
Global Overview
FOREWORD | REN21 President
In Uruguay, we achieved what many thought impossible: we transformed our power system in less than a decade to run on nearly 100% renewables, half of which come from variable renewables sources like wind and solar. This shift didn't just reduce emissions. It cut energy costs, protected us from global fossil fuel/energy price volatility, expanded energy access to 99.9% of households, and created 50,000 new jobs – 3% of our workforce. But it doesn't end there. My country is now making progress in decarbonizing the industrial sector (where we've already reached 65% renewable energy) and, above all, in electrifying the demand for home heating with heat pumps and with electric mobility. Our experience shows that the energy transition is not a burden, but a foundation for resilience and prosperity. A renewables-based economy is not a theory. It is already working, in my country and in many others.
Yet today, we face a paradox. Now that we know a renewables-based electricity system works – and is often the cheapest option – the transition across the broader energy system is slowing, not accelerating. The power sector has proven that the renewable transformation is both technically feasible and economically viable, offering a blueprint for decarbonising heating, transport and industrial processes.
This is not a technical problem. It is a systemic one. Despite clear evidence from the power sector's success, fossil fuels remain favoured by markets, laws and outdated narratives. We are in the middle of a cultural and political battle, a battle of worldviews, and we need every voice at the table to transform our energy system.
That is why the Renewables Global Status Report (GSR) and REN21 are uniquely important. The GSR brings together facts, trends and real-world insights. It shows what is working, what is missing and what is possible. It connects governments, businesses, researchers and communities around a shared understanding. REN21 adds value not by doing what others do, but by enabling what no one can do alone – being a multi-stakeholder catalyst and building a common agenda.
Ensuring reliable, accessible and resilient renewable energy for all is not just about changing fuels. It's about changing the system. This is not a small adjustment; it's a deep transformation. And to make it happen, we need courage, we need collaboration, and above all, we need clarity. That's what this Global Overview offers: a clear picture, built from real experiences, to help all of us move forward together.
Ramón Méndez Galain
President, REN21
Ramón Méndez Galain
Former Energy Secretary,
UruguayPresident, REN21
FOREWORD | REN21 Executive Director
2024 marked a pivotal moment for renewable energy. The world added over 700 GW of renewable power capacity – the largest annual increase to date. This record growth signals real momentum in the shift to renewables.
But it came against a stark backdrop. For the first full year on record, global temperatures remained above 1.5°C. Wildfires, floods and other climate-driven disasters disrupted lives and energy systems across continents, underscoring the urgent need for systemic change.
Fossil fuels continued to fill part of rising energy demand, pushing CO₂ emissions up by 0.8%. Yet the scale of renewable deployment shows growing capacity to meet global needs, and to shape a different energy future.
Despite policy reversals in some regions, many governments advanced bold renewable strategies. Energy security is now understood as not just fuel supply, but resilience, affordability and infrastructure.
This shift matters. Renewables deliver more than climate benefits: they offer stability, energy sovereignty and economic resilience. The technologies exist. The momentum is here. What's needed now is sustained political will and scaled-up investment.
To unlock the sector's full potential, we must build flexible grids, reform institutions, align sectors and direct finance where it drives real impact. With coordinated structural change, renewables can power resilient, equitable economies.
The Renewables 2025 Global Status Report captures insights from across our global network. It provides decision makers with the tools to act – urgently and at scale.
We thank the REN21 network, our global contributors, and the REN21 Secretariat team. Let us move forward together with purpose, determination, and the resolve to turn momentum into lasting change.
Rana Adib
Executive Director, REN21
Rana Adib
Executive Director, REN21

Introduction
GLOBAL CONTEXT
In 2024, global renewable energy growth was primarily driven by the power sector, where capacity expanded by 741 gigawatts (GW), the largest annual increase ever recorded. 1 Solar photovoltaics (PV) led this growth, supported by rapidly falling costs, large-scale deployments and mature supply chains; however, growth in wind energy installations slowed. 2 Deployment of battery storage hit record levels, driven by falling prices and growing recognition of storage as critical for grid reliability. 3 Despite this momentum, renewable energy growth could not keep pace with rising global electricity demand. 4
Growth in electricity demand was driven by higher temperatures, industrial expansion and rapid electrification in emerging markets. 5 Data centres consumed large amounts of electricity as use of artificial intelligence (AI) technologies continued to grow. 6 Renewables were deployed to meet some of this demand, and fossil fuels filled the gap. 7 Global energy-related carbon dioxide (CO₂) emissions increased 0.8% compared to 2023. 8
The year 2024 was the hottest on record, and for the first time the global average temperature exceeded 1.5 degrees Celsius (°C) above pre-industrial levels over a full calendar year. 9 Climate impacts intensified worldwide: Los Angeles (United States) faced severe wildfires, Valencia (Spain) experienced extreme flooding, droughts hit Latin America, and flash floods inundated the Caribbean. 10 These events disrupted communities, economies, and energy systems, with vulnerable regions suffering the most. This series of disasters again emphasises that the climate emergency is not a future threat – it is already disrupting lives and livelihoods across the planet.
Energy security remained in the spotlight in 2024, as geopolitical tensions, trade disruptions and rising economic nationalism influenced national energy strategies. 11 (See Sidebar 1.) Countries sought to secure supply, reduce external dependencies and control prices. While some countries accelerated their investments in renewables and energy storage to reduce risk and increase resilience, fossil fuel investments also grew, often driven by industrial lobbying and short-term security concerns. 12 As these developments underscore, the energy transition is shaped not only by technical and economic factors, but also by political and governance choices, domestic pressures and competing visions of national interest.
Renewable energy is no longer just a climate solution; it is essential infrastructure. In a world of intersecting crises, renewables support sustainable economic development, public health and energy security.
Sidebar 1. Energy Security
Energy security is again at the centre of policy agendas worldwide, but the meaning of security and the ways it is pursued are evolving. Once defined as having an uninterrupted fuel supply and strategic reserves, energy security is now viewed through a broader lens. It includes affordability and access to energy, resilience to physical and digital threats, control over energy infrastructure and technologies, and the capacity to withstand climate, economic and geopolitical shocks. Governments, regulators and institutions are adjusting their strategies to confront overlapping crises and deep structural dependencies.
Affordability has emerged as a dominant concern in both high-income and low-income countries. Surging prices for fossil fuels have triggered political and economic instability, prompting governments to introduce subsidies, tax breaks and emergency transfers. These measures offer short-term relief but often entrench fiscal vulnerabilities, delay structural reform and are often poorly distributed.
In countries with long-standing fuel subsidies, price volatility has led to unrest or service breakdowns. Removing subsidies can deepen poverty – particularly if not paired with measures to make clean alternatives, such as renewable electricity and clean cooking, more affordable. Policy makers increasingly present renewables and electrification as long-term stabilisers of energy markets. Their effectiveness, however, depends on the availability of inclusive financing mechanisms such as pay-as-you-go models, concessional credit and targeted public investment.
In many regions, energy security is still defined by the uninterrupted availability of energy sources at an affordable price. Countries in sub-Saharan Africa and South Asia, as well as many small-island developing states, continue to face chronic energy insecurity due to limited electricity access and underinvestment. As the global energy transition accelerates, the risk of exclusion is growing. Without deliberate efforts to expand distributed systems and to close service gaps, millions will be left behind.
Infrastructure resilience has become a central pillar of energy security. Droughts, floods, wildfires and heatwaves are damaging power generation assets, grid systems and transport infrastructure. System operators are responding with updated reliability standards, climate contingency plans and investments in decentralised, modular systems. These investments not only improve climate resilience but also support domestic industrial capacity and job creation, reinforcing local economies.
The role of renewables in strengthening resilience is increasingly evident. Decentralised systems can maintain energy supply during extreme events. Renewable-powered mini- and microgrids support adaptation to climate impacts and energy system shocks in both remote and urban settings, through technologies such as wind and solar power and geothermal energy. Yet resilience planning remains underfunded in many countries, particularly where infrastructure is centralised or ageing.
As digital risks grow, cybersecurity has become a core element of energy governance. Attacks on wind farms, transmission systems and energy management platforms across Europe, Latin America and Asia have revealed vulnerabilities in highly connected systems. As digitalisation expands, so does the range of potential attacks. Governments are developing national cyber strategies, auditing hardware supply chains and improving co-ordination among energy and security agencies. However, many countries, particularly in the Global South, still lack the regulatory frameworks and institutional capacity to ensure digital resilience.
Strategic autonomy is shaping a new wave of industrial policy. Countries are not only seeking to diversify their fuel sources, but also to reduce dependence on imported technologies critical to the energy transition. The United States, European Union, India and others have launched large-scale initiatives to localise manufacturing of solar PV, batteries, wind turbines and hydrogen electrolysers.
In parallel, some governments have doubled down on fossil fuels and nuclear energy. Still, the growth of domestic renewable energy industries is increasingly seen as a pathway to more resilient supply chains and long-term economic gains. In China renewables and enabling technologies contributed to an estimated 10% of gross domestic product (GDP) in 2024. Ensuring secure access to supply chains, innovation ecosystems and intellectual property is now treated as a core energy security priority. As a result, geopolitical focus is shifting from fossil fuel transport corridors to manufacturing hubs and trade rules that govern access to low-carbon technologies.
Security concerns have also spurred greater investment in electric vehicles (EVs), particularly in fossil fuel importing countries such as China, India and Türkiye. However, rising trade restrictions threaten to undermine this progress. In the first half of 2025, tariffs on EVs and lithium-ion batteries from China, imposed by the United States and the EU, increased costs and slowed the deployment. Meanwhile, manufacturing overcapacity in China has helped drive down global prices for solar panels, batteries and EVs. This dynamic has improved affordability but also threatens the commercial viability of new manufacturing projects outside China, raising concerns about long-term competitiveness and resilience.
At the same time, nationalist and populist actors are using energy security narratives to justify protectionist or anti-climate policies. In multiple regions, calls for energy sovereignty have gained political traction. Although national control over energy supply is a legitimate goal, its politicisation brings the risk of undermining co-operation and delaying progress on shared resilience and decarbonisation objectives.
Energy security is no longer a narrow technical issue; it has become a central organising principle of energy policy. But without a systemic and inclusive approach, today's responses could deepen inequality and reinforce fragmentation. Lasting energy security must be built on resilience, equity, and long-term vision, with systems designed to serve both people and the planet.
Source: See endnote 11.
RENEWABLE ENERGY DEVELOPMENTS AND TRENDS
In 2024, global renewable power capacity increased 18%, adding a record-breaking 741 GW. 13 Solar PV was the primary driver, contributing 602 GW and accounting for 81% of the total capacity increase. 14 Wind energy followed, adding 117 GW globally. 15 Other renewable sources – whether for power, heat or transport fuels – accounted for only small additions to the global energy supply. China was the dominant contributor to new renewable power deployment, responsible for 60% of the global total. 16 The Group of Seven (G7) nations accounted for just around 14%. 17 Even at the record growth levels of 2024, projections indicate that the world will fall 800 GW short of the internationally agreed target calling for a tripling of renewable power by 2030. 18
Despite its dominant contribution, the annual growth rate of solar PV power capacity additions fell to 32%, down from 82% in 2023 and 35% in 2022. 19 This slowdown reflects growing challenges, including grid saturation, policy shifts and tighter financing in several key markets. 20 Wind power capacity grew 0.2%. 21 China continued to expand its wind energy capacity, adding 79.8 GW in 2024, whereas additions in other regions slowed significantly. 22
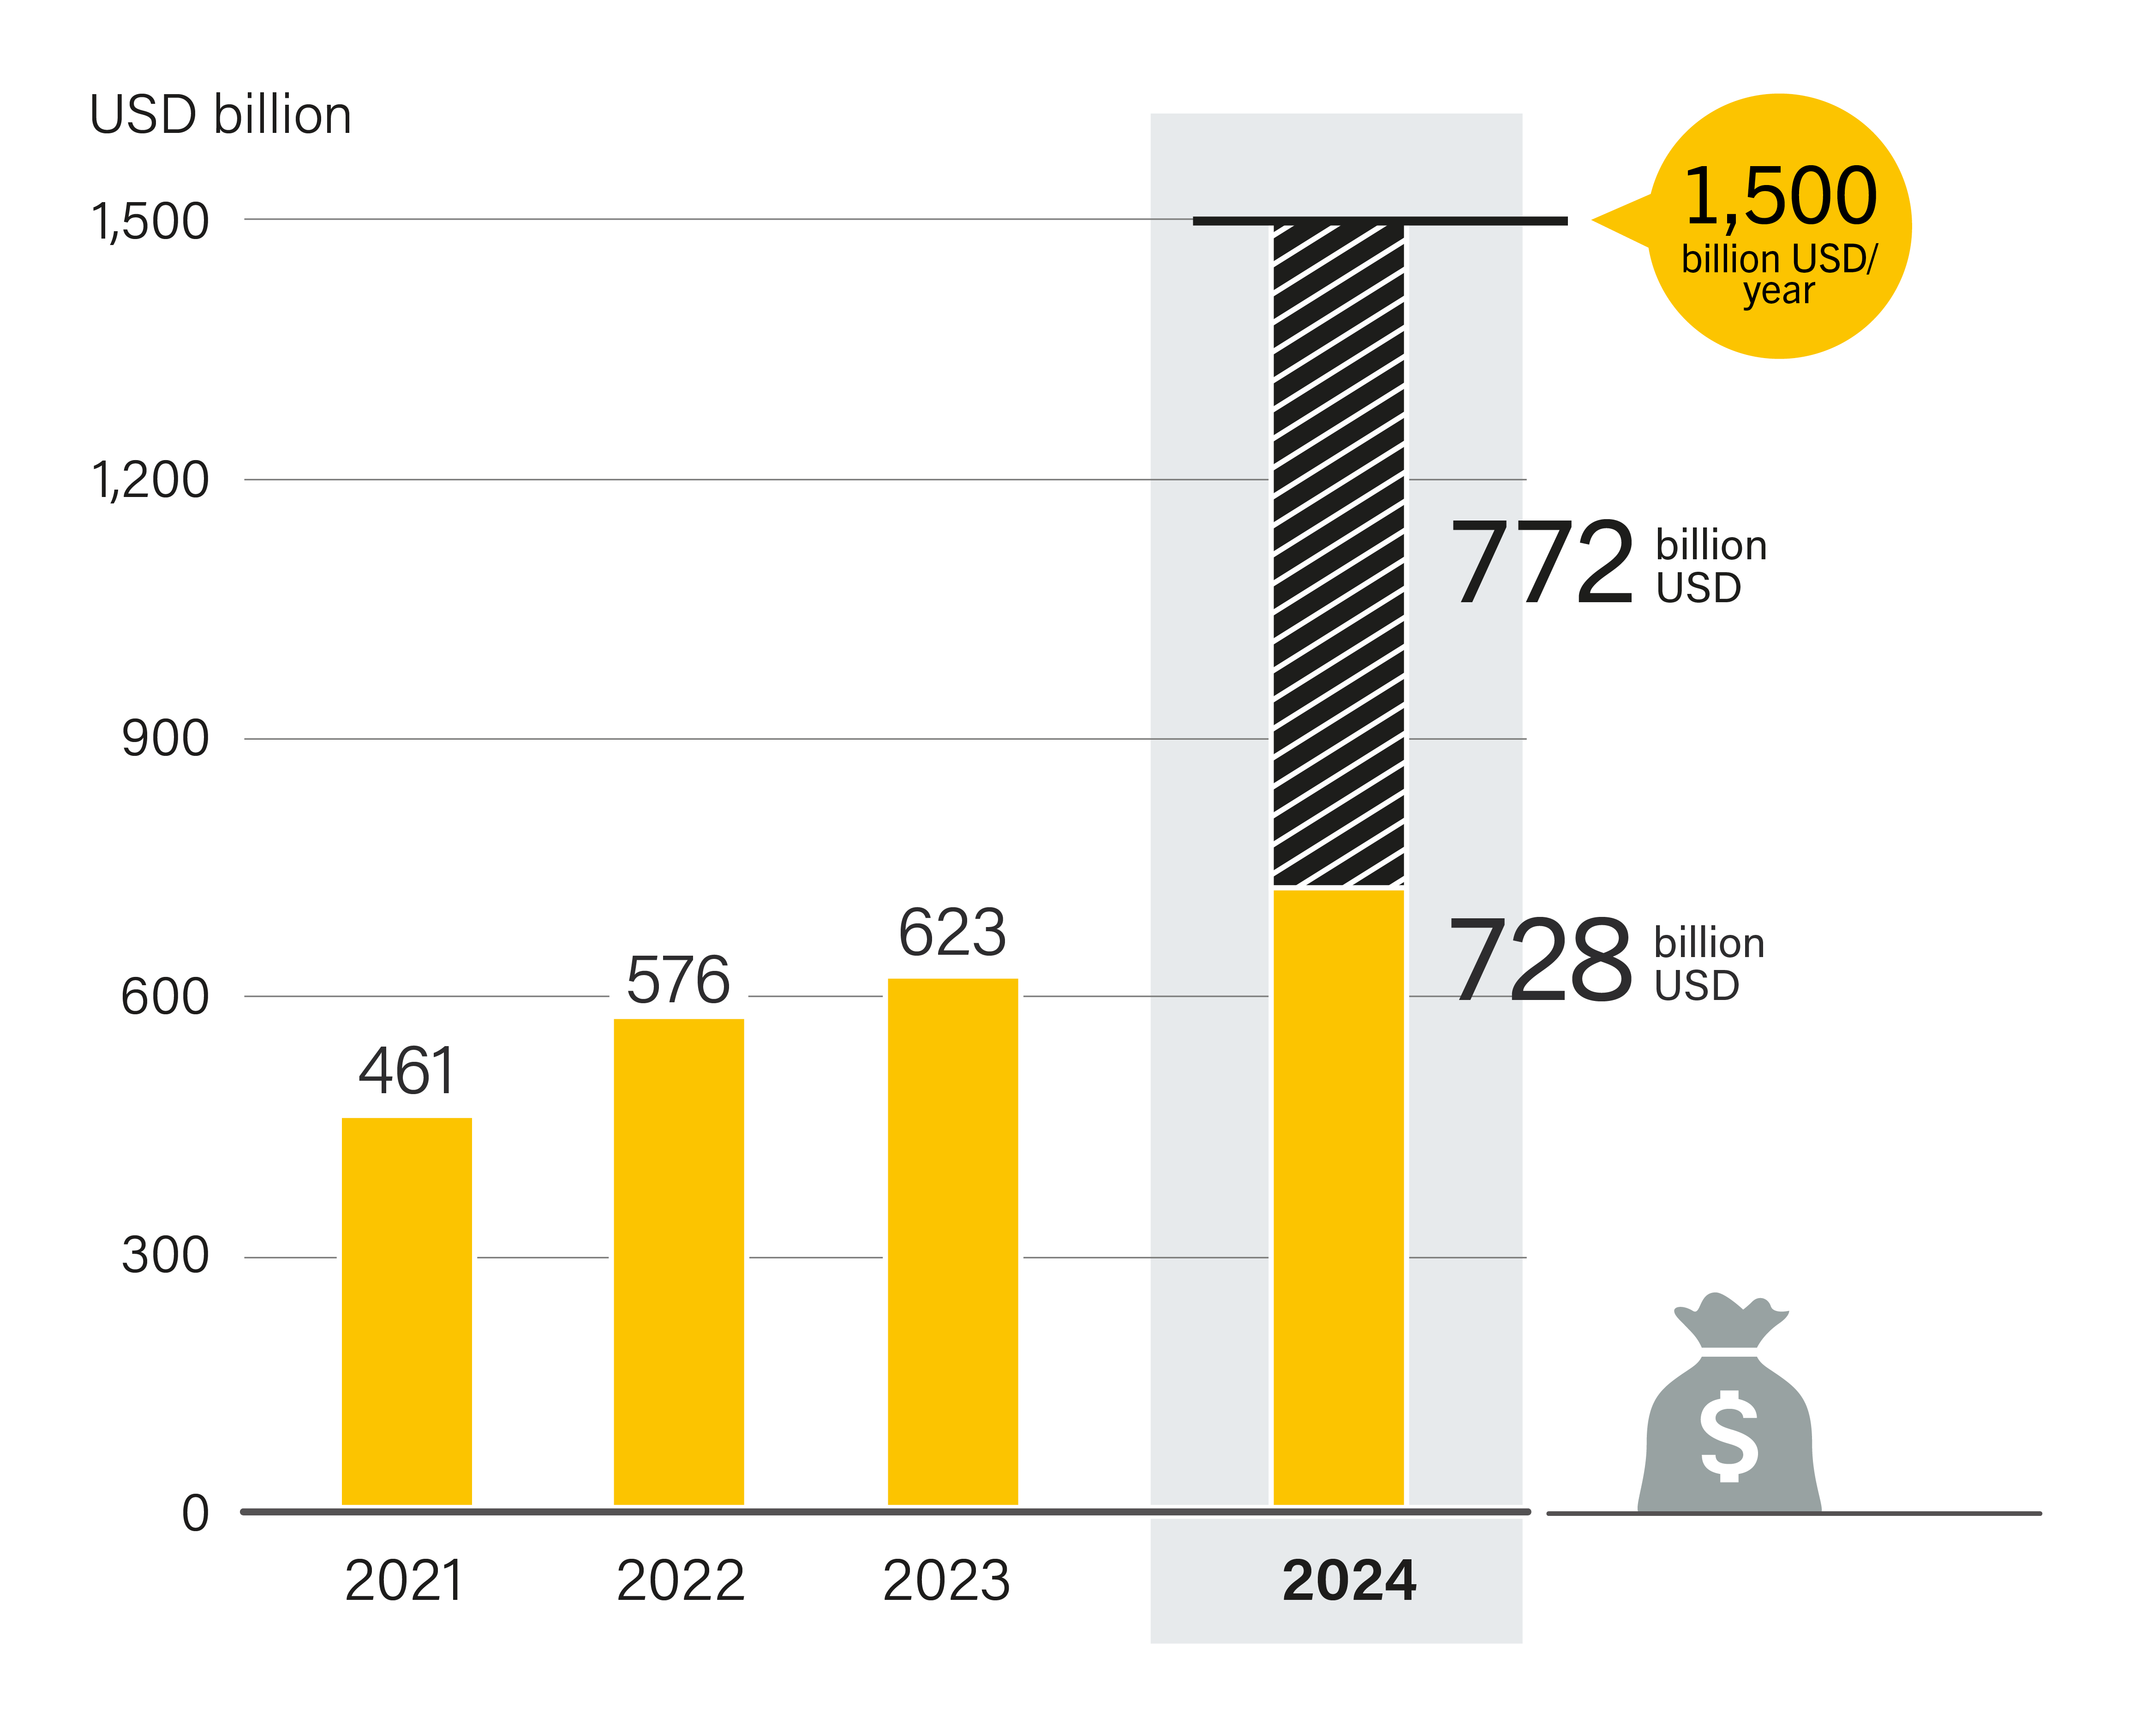
Electricity generation from renewables increased 10% in 2024, doubling the 5% increase seen in 2023. 23 However, this growth was accompanied by a slowing of investment. Total global investment in renewable energy i reached USD 728 billion in 2024, up 8% from the previous year. 24 This was well below the growth rates of 19% in 2023 and 23% in 2022. 25 The main reason for this slowdown was a substantial decline in wind power investment. 26
Electric vehicle sales reached a new record in 2024, with 17 million units sold worldwide. 27 Despite this milestone, the global growth in EV sales slowed to 25%, compared with 34% in 2023 and 55% in 2022. 28 Strong demand in China and other emerging economies was in contrast to modest gains in the United States and a clear slowdown in the European Union (EU). 29 In Europe, the withdrawal of EV purchase subsidies in Germany, combined with the anticipated roll-out of EU-wide CO₂ standards in 2025, led to a cooling of consumer demand. 30 Meanwhile, investment in road transport infrastructure increased 20% to reach USD 757 billion in 2024, exceeding investment in renewables ii . 31 Global investment in heat pumps fell from USD 81.4 billion in 2023 to USD 77.1 billion in 2024, with a slowdown in sales in key markets (especially Europe) due to economic conditions, subsidised fossil fuels and reduced incentives. 32
RENEWABLES IN THE GLOBAL ENERGY SYSTEM
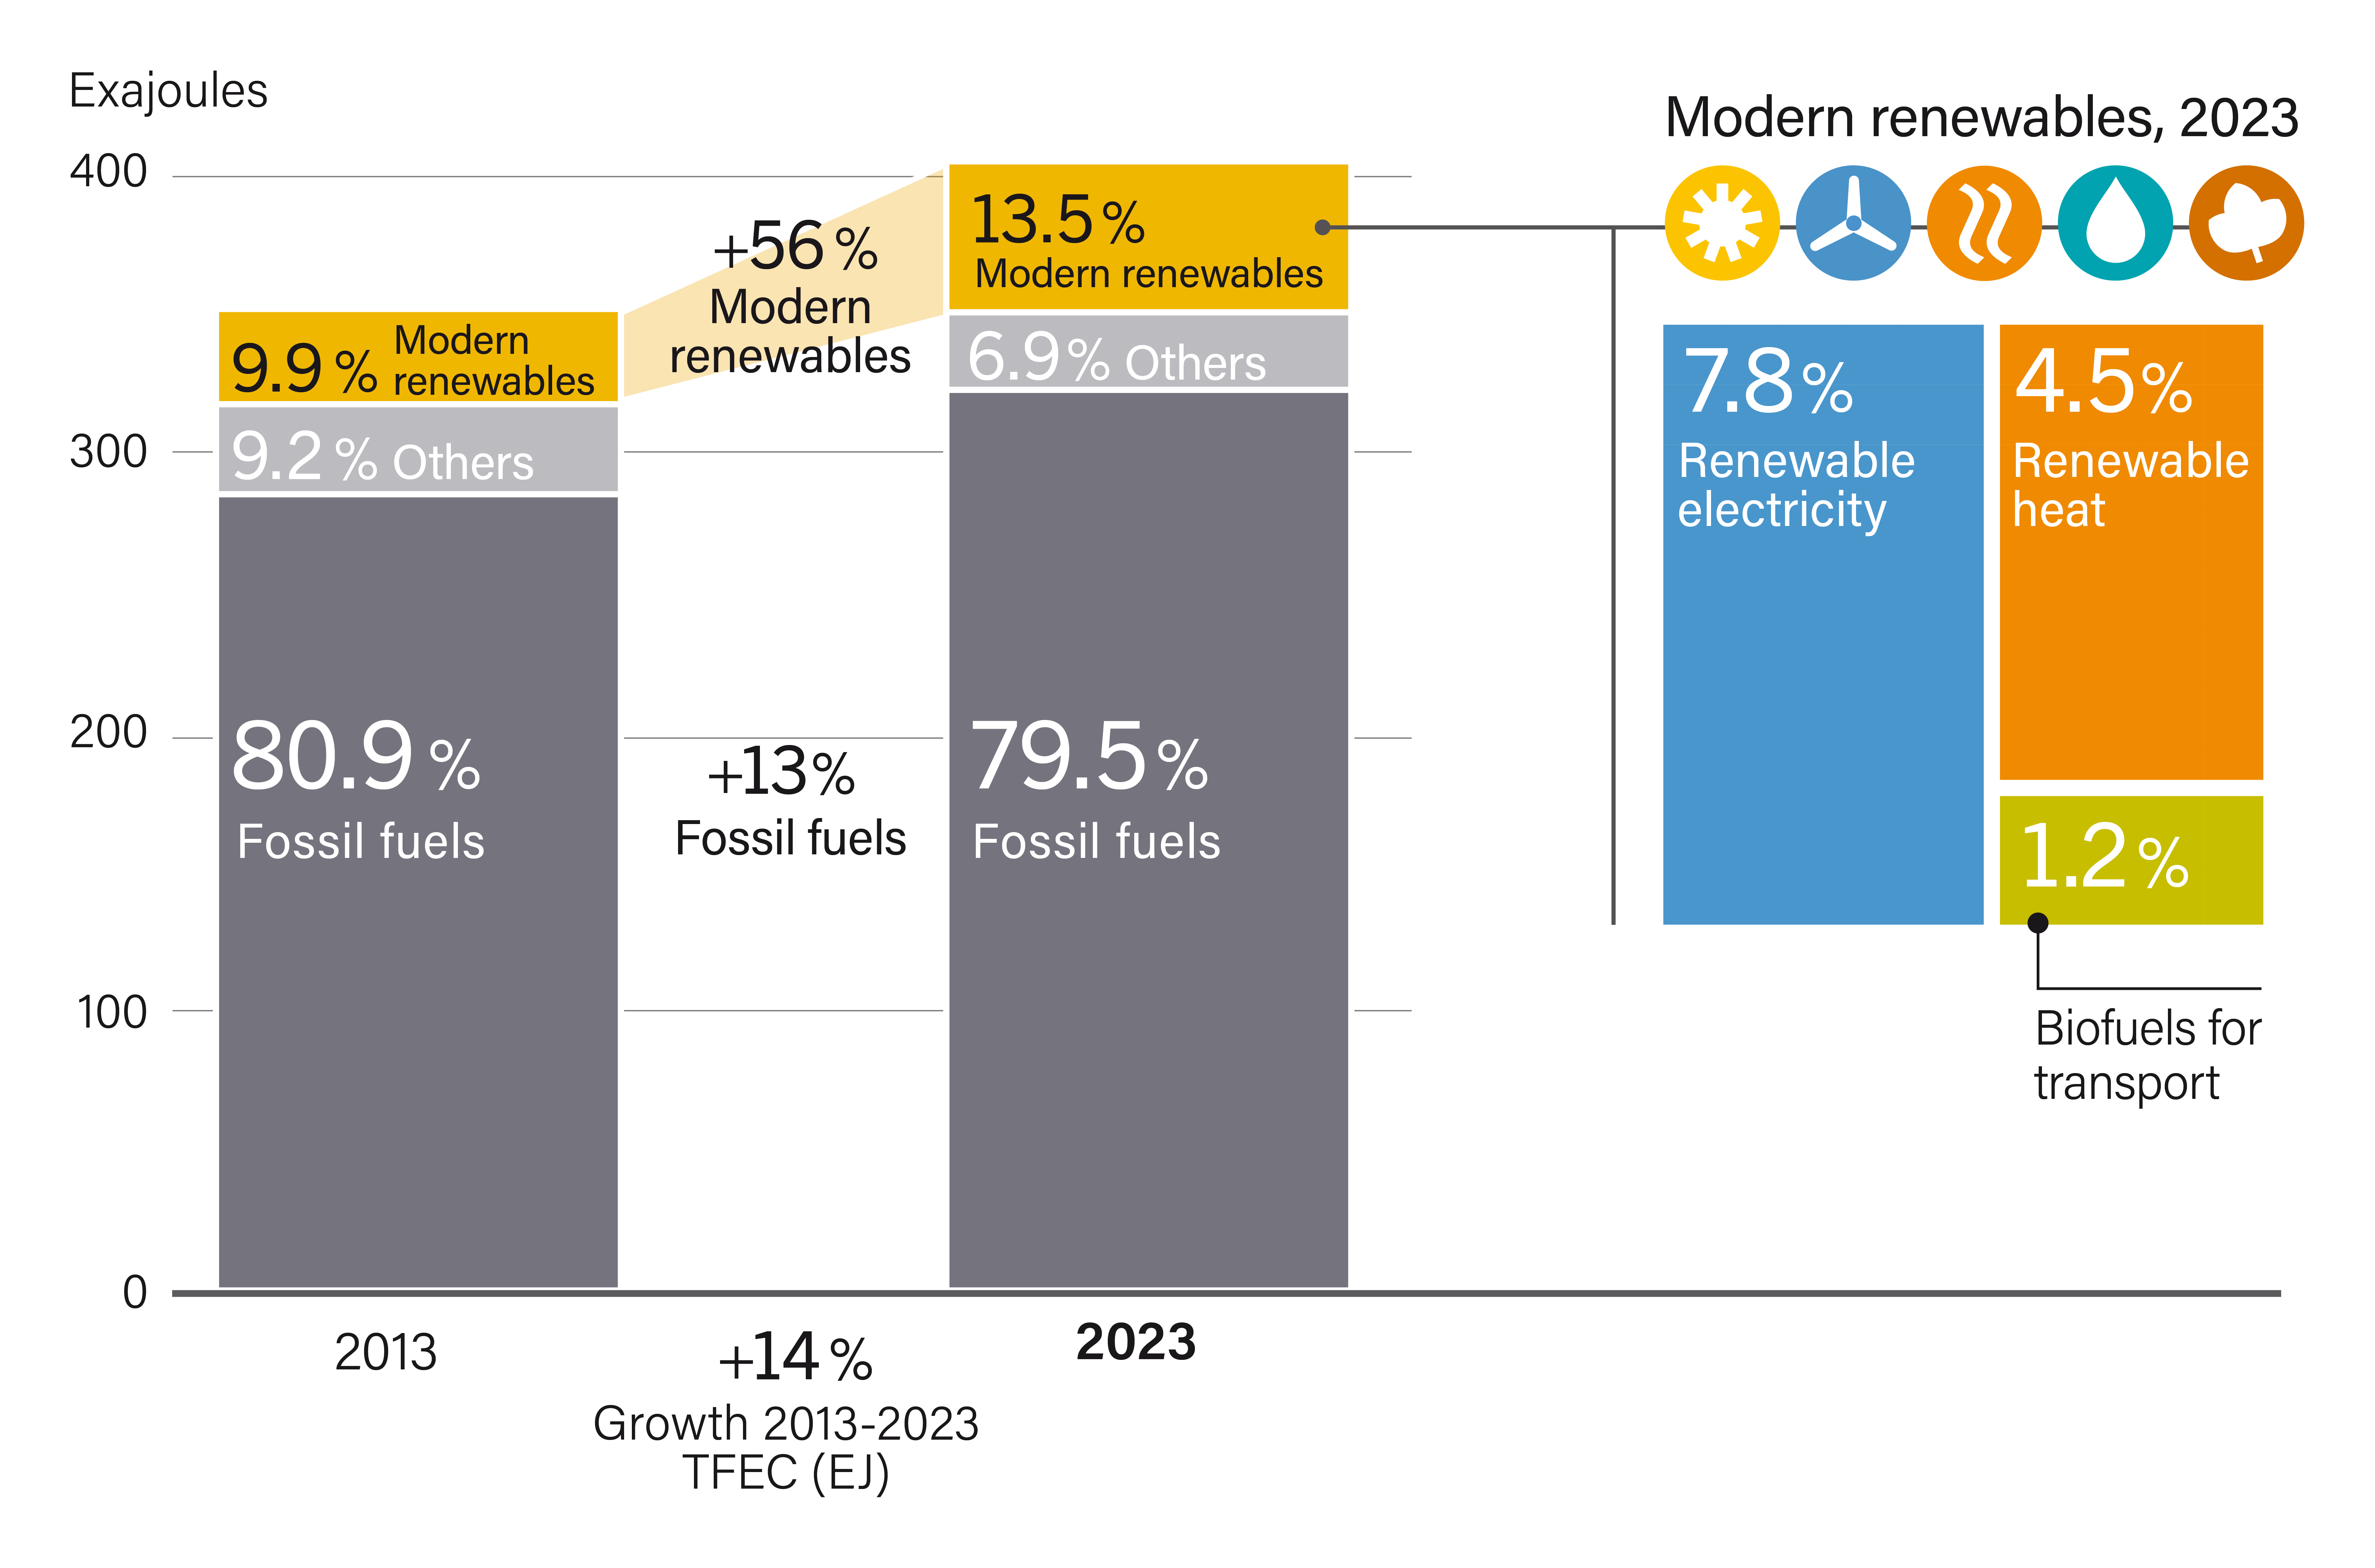
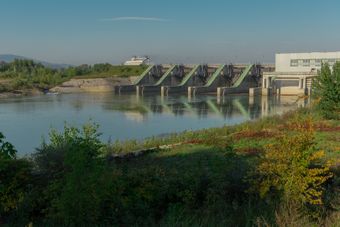
Global energy demand continued to rise in 2023. 33 The increase was reflected across all end-use sectors, as total final energy consumption (TFEC) grew 2.2%. 34 The estimated share of renewable energy in TFEC in 2023 was 13.5%. 35 (See Figure 1.) Industry remained the largest end-use sector, accounting for 34% of total consumption, followed by buildings (31%), transport (31%) and agriculture (2.5%) and other energy uses (1.5%). 36 In 2023, Iceland remained the country with the highest share of renewable energy in TFEC at 83%, owing to hydropower and geothermal; Lao People's Democratic Republic (PDR) (73%) and Gabon (66%) followed, both of which rely heavily on hydropower. 37 (See Figure 2.)
FIGURE 1 Total Final Energy Consumption by Source, 2013 and 2023
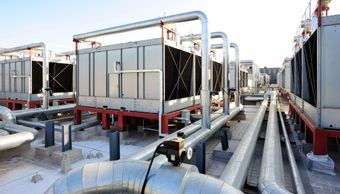
Sets of cooling towers in the data center
FIGURE 2 Renewable Share of Total Final Energy Consumption, by Country, 2022
Electricity demand increased 4.3% in 2024, up from growth of 2.5% in 2023 and well above the annual average growth of 2.7% between 2010 and 2023. 38 This increase was driven primarily by rising cooling needs and rapid industrial development in emerging economies. 39 Energy demand also rose in advanced economies, notably in the United States, where the proliferation of infrastructure for data centres created substantial new electricity loads. 40
Renewable capacity additions met two-thirds of the increase in global power demand, while the use of fossil fuels, particularly coal and natural gas, also increased. 41 Electricity from coal reached a global all-time high in 2024, although the growth rate slowed to 0.88% (1.7% in 2023). 42 In total, 44 GW of new coal-fired power capacity was commissioned in 2024, surpassing the 25.2 GW of coal capacity that was retired in the same period. 43
The number of people without access to electricity declined by more than 8 million from over 745 million in 2023 to around 737 million in 2024. 44 Sub-Saharan Africa accounted for the vast majority of the global electricity access gap, with 80% of those without access residing in the region. 45 Achieving Sustainable Development Goal 7.1 – universal electricity access by 2030 – would require the number of people without access to decline at a rate roughly ten times faster than the current pace. 46
Meanwhile, global progress on energy efficiency remained weak at around 1% in 2024. 47 This was unchanged from 2023 and well below the average annual gains of the previous decade. 48 This stagnation is particularly concerning in light of the commitment made at the 2023 United Nations Climate Change Conference in Dubai, United Arab Emirates (COP 28) to double the annual rate of energy efficiency improvement from 2% to 4% by 2030. 49 Gains were led primarily by the United States and the EU, where regulatory frameworks and market incentives helped reduce energy waste across sectors. 50
The insufficient deployment of renewables and slow progress on energy efficiency meant that emissions again increased in 2024, albeit at the slowest rate since the easing of the COVID-19 pandemic in 2021. 51
More than 2x investment needed to reach COP28 tripling target.
Several governments and private actors showed evidence of backsliding on climate and energy commitments amid rising trade barriers, grid-related constraints, political shifts and policy changes. 52 In early 2025, the new United States administration announced plans to withdraw once again from the Paris Agreement, promote fossil fuels, and roll back domestic and international support for renewables and climate-related projects. 53 The EU postponed its implementation of stricter CO₂ emission standards that had been scheduled for 2025. 54 New Zealand reversed its ban on offshore oil and fossil gas exploration and withdrew incentives for EVs, although the government also took measures to speed up consenting processes for renewable energy installations. 55
The underlying economics of renewable energy have nonetheless continued to improve, and renewables increasingly outcompete fossil fuel technologies on cost grounds alone. 56 To achieve the internationally agreed target to triple renewable energy power capacity by 2030, an additional USD 772 billion investment will be needed between 2025 and 2030. 57 (See Figure 3.)

FIGURE 3 Investment Gap to Reach the COP 28 Tripling Power Target by 2030
i Data from BloombergNEF classify the following technologies as renewables: biofuels; biomass and waste; geothermal; ocean; small hydropower (between 1-50 MW); solar; and wind.
ii Including EV and fuel-cell vehicle sales and charging infrastructure.

Policy and Commitments
In 2024, policies and commitments on renewables showed uneven progress. Some governments raised ambition through updated targets and supporting policy mechanisms, while others stalled or backtracked. Most policy attention continued to centre on the renewable power sector, with less focus on renewable heating, cooling and renewable fuels i . 1
CLIMATE AND ENERGY COMMITMENTS
Several new international climate and energy commitments were announced in 2024, yet their implementation remained vague. At the 2024 United Nations Climate Change Conference in Baku, Azerbaijan (COP 29), developed countries agreed to triple climate finance for developing nations. 2 The new target is for developed countries to provide USD 300 billion annually, with combined public and private flows expected to reach USD 1.3 trillion per year by 2035. 3 However, this outcome drew criticism from civil society organisations and climate-vulnerable countries — including least developed countries and members of the Alliance of Small Island States (AOSIS) — which argued that the pledges fall short of what is needed in light of escalating climate impacts and the urgent need for adaptation finance. 4 The agreement also lacked clarity on how the funds would be mobilised and allocated. 5
Only 22 countries submitted updated NDCs by May 2025.
The final outcome document of COP 29 did not call for “transitioning away from fossil fuels”, reflecting a step backwards compared to the stronger language adopted a year earlier at COP 28. 6 This omission was seen by many as a setback for global climate policy, and an indication of the ongoing resistance from fossil fuel interests that is weakening the push for co-ordinated phase-out strategies. 7

COP 29 delivered three notable energy pledges:
• A pledge on Green Energy Zones and Corridors – backed by 57 countries, including Belgium, Türkiye, and the United Kingdom, along with non-governmental actors – aims to connect renewable-rich areas with demand centres through large-scale inter-regional grids. 8
• The Global Energy Storage and Grids Pledge, which included commitments from 65 countries, sets collective goals to deploy 1,500 gigawatts (GW) of energy storage, double global grid investment and build 25 million kilometres of new grid infrastructure by 2030. 9
• The Hydrogen Declaration committed 62 countries to scale up green hydrogen production and reduce their reliance on fossil-based hydrogen. 10 Green hydrogen output was less than 1 million tonnes in 2024, compared to 96 million tonnes for fossil-derived hydrogen. 11
The Group of Seven (G7) countries announced a pledge to phase out “unabated” coal power plants between 2030 and 2035. 12 The language left room for interpretation, allowing countries to align with their own pathways towards net zero greenhouse gas emissions, seen as a concession to coal-dependent G7 members such as Germany and Japan. 13 The G7 also remains unlikely to meet its earlier target of eliminating “inefficient” fossil fuel subsidies by 2025. 14 Global subsidies for fossil fuels remained high at USD 1.1 trillion in 2023 ii . 15 Although this was down from the record USD 1.7 trillion in 2022, it remains a major barrier to the energy transition. 16
Global subsidies for fossil fuels remained high at 1.1 USD trillion in 2023.
Whereas international-level pledges help set the tone for global ambition, national commitments determine whether this ambition translates into tangible progress. This is particularly evident in the case of energy access. An estimated 737 million people worldwide still lacked access to electricity as of 2024. 17 Current improvement rates remain far below what is needed to meet the target for universal electricity access by 2030, set in Sustainable Development Goal (SDG) 7.1. 18 While some governments have adopted national energy access targets in line with SDG 7, underpinned by renewable energy strategies, many fall short on implementation and financing. 19 (See Sidebar 2.).
As of May 2025, of the 195 Parties that had signed the Paris Agreement, 180 had submitted at least one set of Nationally Determined Contributions (NDCs) in the decade since 2015. 20 However, only 22 countries (together contributing just 21% of global greenhouse gas emissions) had submitted their updated NDCs iii , which include climate targets for 2025-2035. 21
Changes in government, leadership or political priorities led several countries to reverse or delay overall climate measures in 2024. 22 Just 13 countries met the NDC submission deadline of 10 February 2025, and several major emitters missed the deadline. 23 However, all 22 of the updated NDCs submitted by May 2025 referred to renewable energy as a means to support climate mitigation and/or adaptation. 24
Sidebar 2. The Role of Renewables in Universal ACCESS TO ELECTRICITY
Despite continued progress, 737 million people remained without access to electricity in 2024, the vast majority of them in sub-Saharan Africa. Addressing this gap requires a combination of grid expansion and the deployment of decentralised renewable energy solutions. In recent years, a growing number of countries have adopted more ambitious targets and policy frameworks for electricity access, many of which highlight the role of renewables in achieving universal access.
Several countries have set targets for universal electricity access by 2030 or earlier, backed by detailed implementation plans. Chad aims to increase access from only 11% in 2023 to 90% by 2030, targeting 14 million additional people. Côte d'Ivoire plans to raise its access rate from 64% to 100% by 2030, and the Democratic Republic of the Congo aims to provide universal access to electricity by 2030, increasing the access share from 21.5% in 2024.
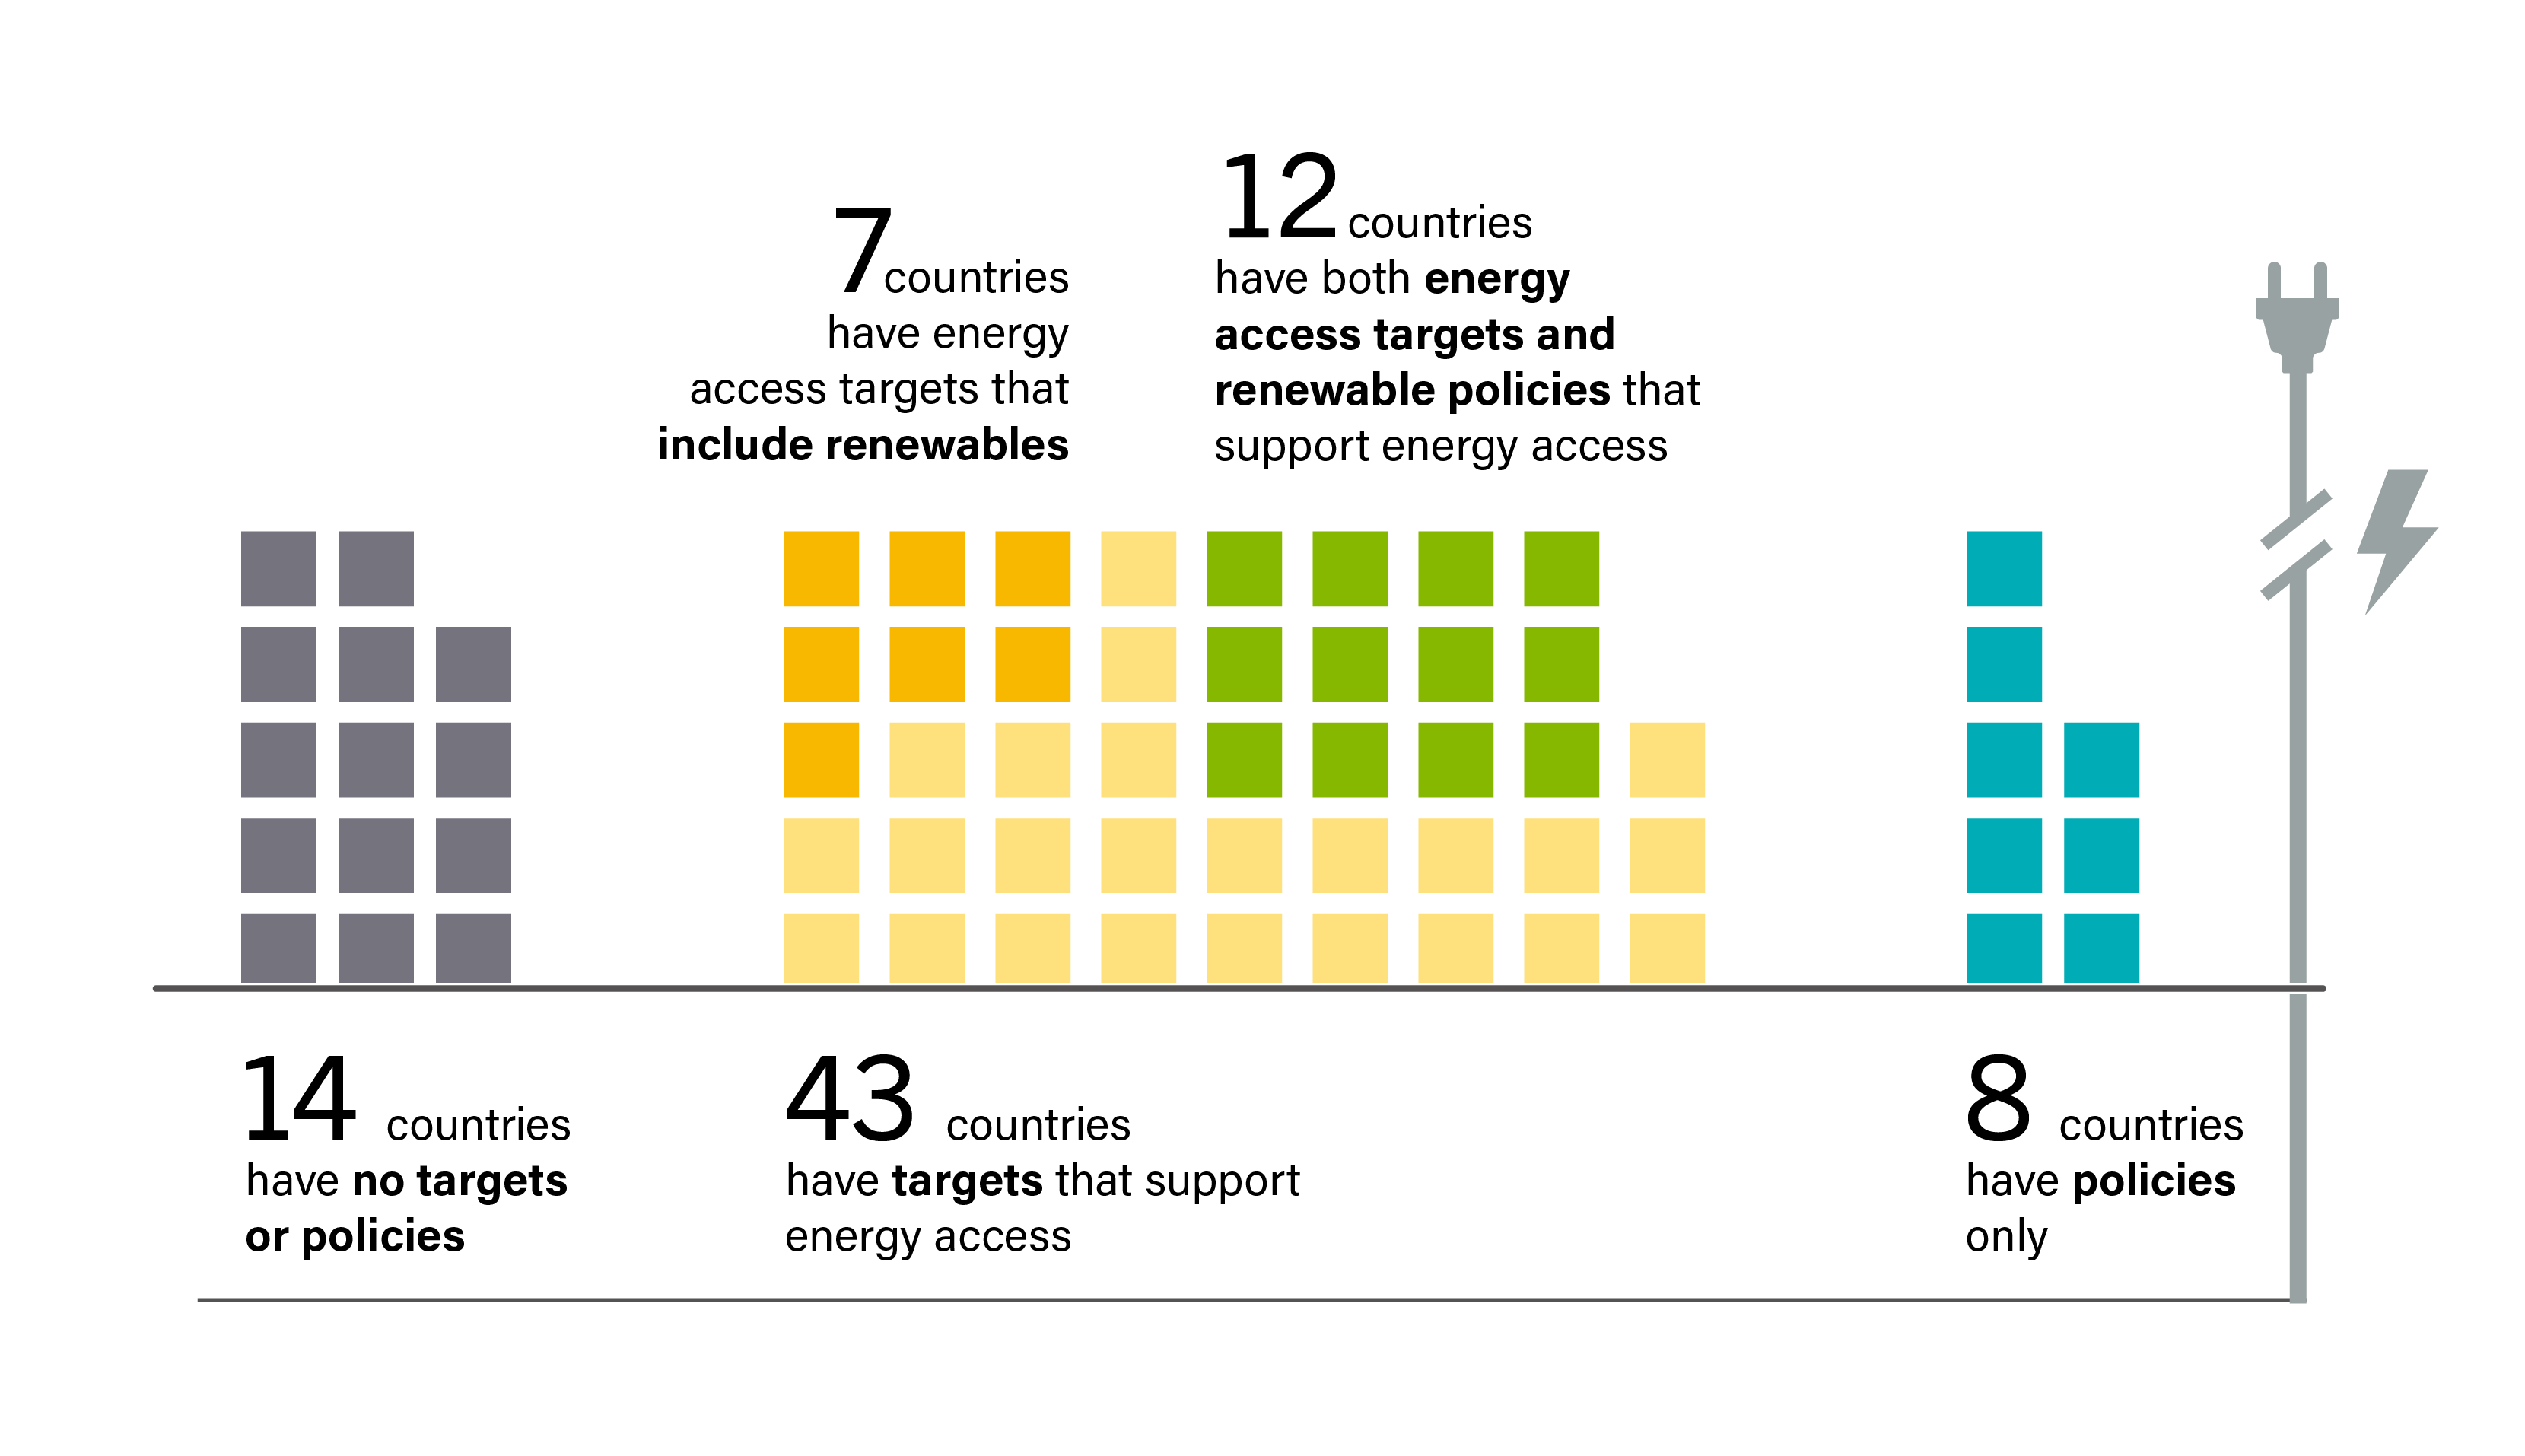
FIGURE 4 Electricity Access Targets and Policies with Renewables in Countries with No Universal Access to Electricity, as of End-2024
Similar targets have been announced in Niger, Nigeria, Senegal and Zambia and include a mix of grid and off-grid strategies, including the deployment of mini-grids and solar home systems, particularly in rural and underserved areas. Zambia plans to double its annual grid connections from 60,000 to 120,000 by 2030 while also scaling up off-grid access. These efforts reflect a broader trend of integrated electrification strategies that combine infrastructure development with decentralised renewable energy deployment.
Several African countries – including Cameroon, Ethiopia, Rwanda, Senegal and Uganda – have adopted relatively comprehensive policy frameworks, with multiple policy types in place and clear links to renewable energy. Ethiopia has four energy access policy types, three of which directly support renewables. The country targets 96% grid connectivity by 2030 and 100% electrification by 2025, with 35% of the population served through off-grid solutions and 65% via grid extension.
These national efforts are increasingly supported by regional initiatives. In 2024, the World Bank, in partnership with the African Development Bank, launched Mission 300, an initiative to connect 300 million people in sub-Saharan Africa to electricity by 2030 (including 250 million through World Bank-supported programmes). Approaches include both grid expansion and decentralised solutions such as solar home systems and mini-grids. The ASCENT programme, targeting eastern and southern Africa, and the Regional Energy Access Financing Platform (REAF) further channel direct finance and performance-based grants to clean energy enterprises, helping to scale up access across the region.
Despite this, many countries remain in the early stages of policy development. Nearly half of countries surveyed (with less than 98% electricity access rates as of 2024) had only one energy access policy type in place (or none at all) and often lacked explicit references to renewables. Burundi, Chad and Liberia all report relatively low electricity access rates and weak policy frameworks, but recent developments suggest a shift towards greater commitment.
While momentum is building, the alignment between electrification plans and renewable energy strategies remains uneven. (See Figure 4.) Ensuring that the expansion of electricity access is both inclusive and sustainable will require greater policy coherence and the integration of renewables in national access frameworks.
As of 2024, 53 countries had carbon pricing policies in place and 45 countries had both net zero emission targets and carbon pricing policies – including carbon taxes and emission trading systems (ETS). 25 (See Figure 5.) However, many of the existing carbon pricing policies cover only a small share of national emissions, or just one end-use sector: 51 countries covered emissions from industry, and 45 countries covered emissions from transport (including aviation), yet only 23 countries covered emissions from buildings and only 17 countries covered emissions from the agricultural sector. 26
As of 2024, 44 countries, including all EU Member States, had established emission trading systems. 27 Only two new countries initiated national carbon pricing frameworks during the year: Pakistan, through the adoption of its National Carbon Market Policy, and Brazil, where the Congress approved a framework law to establish a national ETS. 28 A total of 31 countries had carbon taxes in place in 2024, with no new policies enacted during the year; carbon tax rates ranged from less than USD 1 to USD 167 per tonne of CO2 or CO2 equivalent. 29 Uruguay had the highest carbon tax rate at USD 167 per tonne of CO2 equivalent, followed by Switzerland and Liechtenstein (both with USD 132 per tonne of CO2 iv ). 30
FIGURE 5 Countries with Enacted Climate Change Policies, by Type of Measure, as of 2024
As many as 90 countries had in place targets for net zero greenhouse gas emissions as of 2024, and 68 of these countries set 2050 as the target year. 31 Cabo Verde had the most ambitious target, with 2025 as the target year, followed by Dominica, Liechtenstein, Maldives and Uzbekistan (all with 2030 as the target year). 32 Uganda and Thailand had among the longest timelines for reaching net zero emissions, targeting 2065, and India set its target year to 2070. 33 Additionally, 43 further countries had a net zero target that was proposed or declared only by 2024, but not yet fully enacted. 34 Most policies outlining net zero emission targets include renewable energy as a core feature. 35

Solar PV in Fiji
89 countries had economy-wide renewable energy targets in 2024, while 133 countries had net-zero targets.
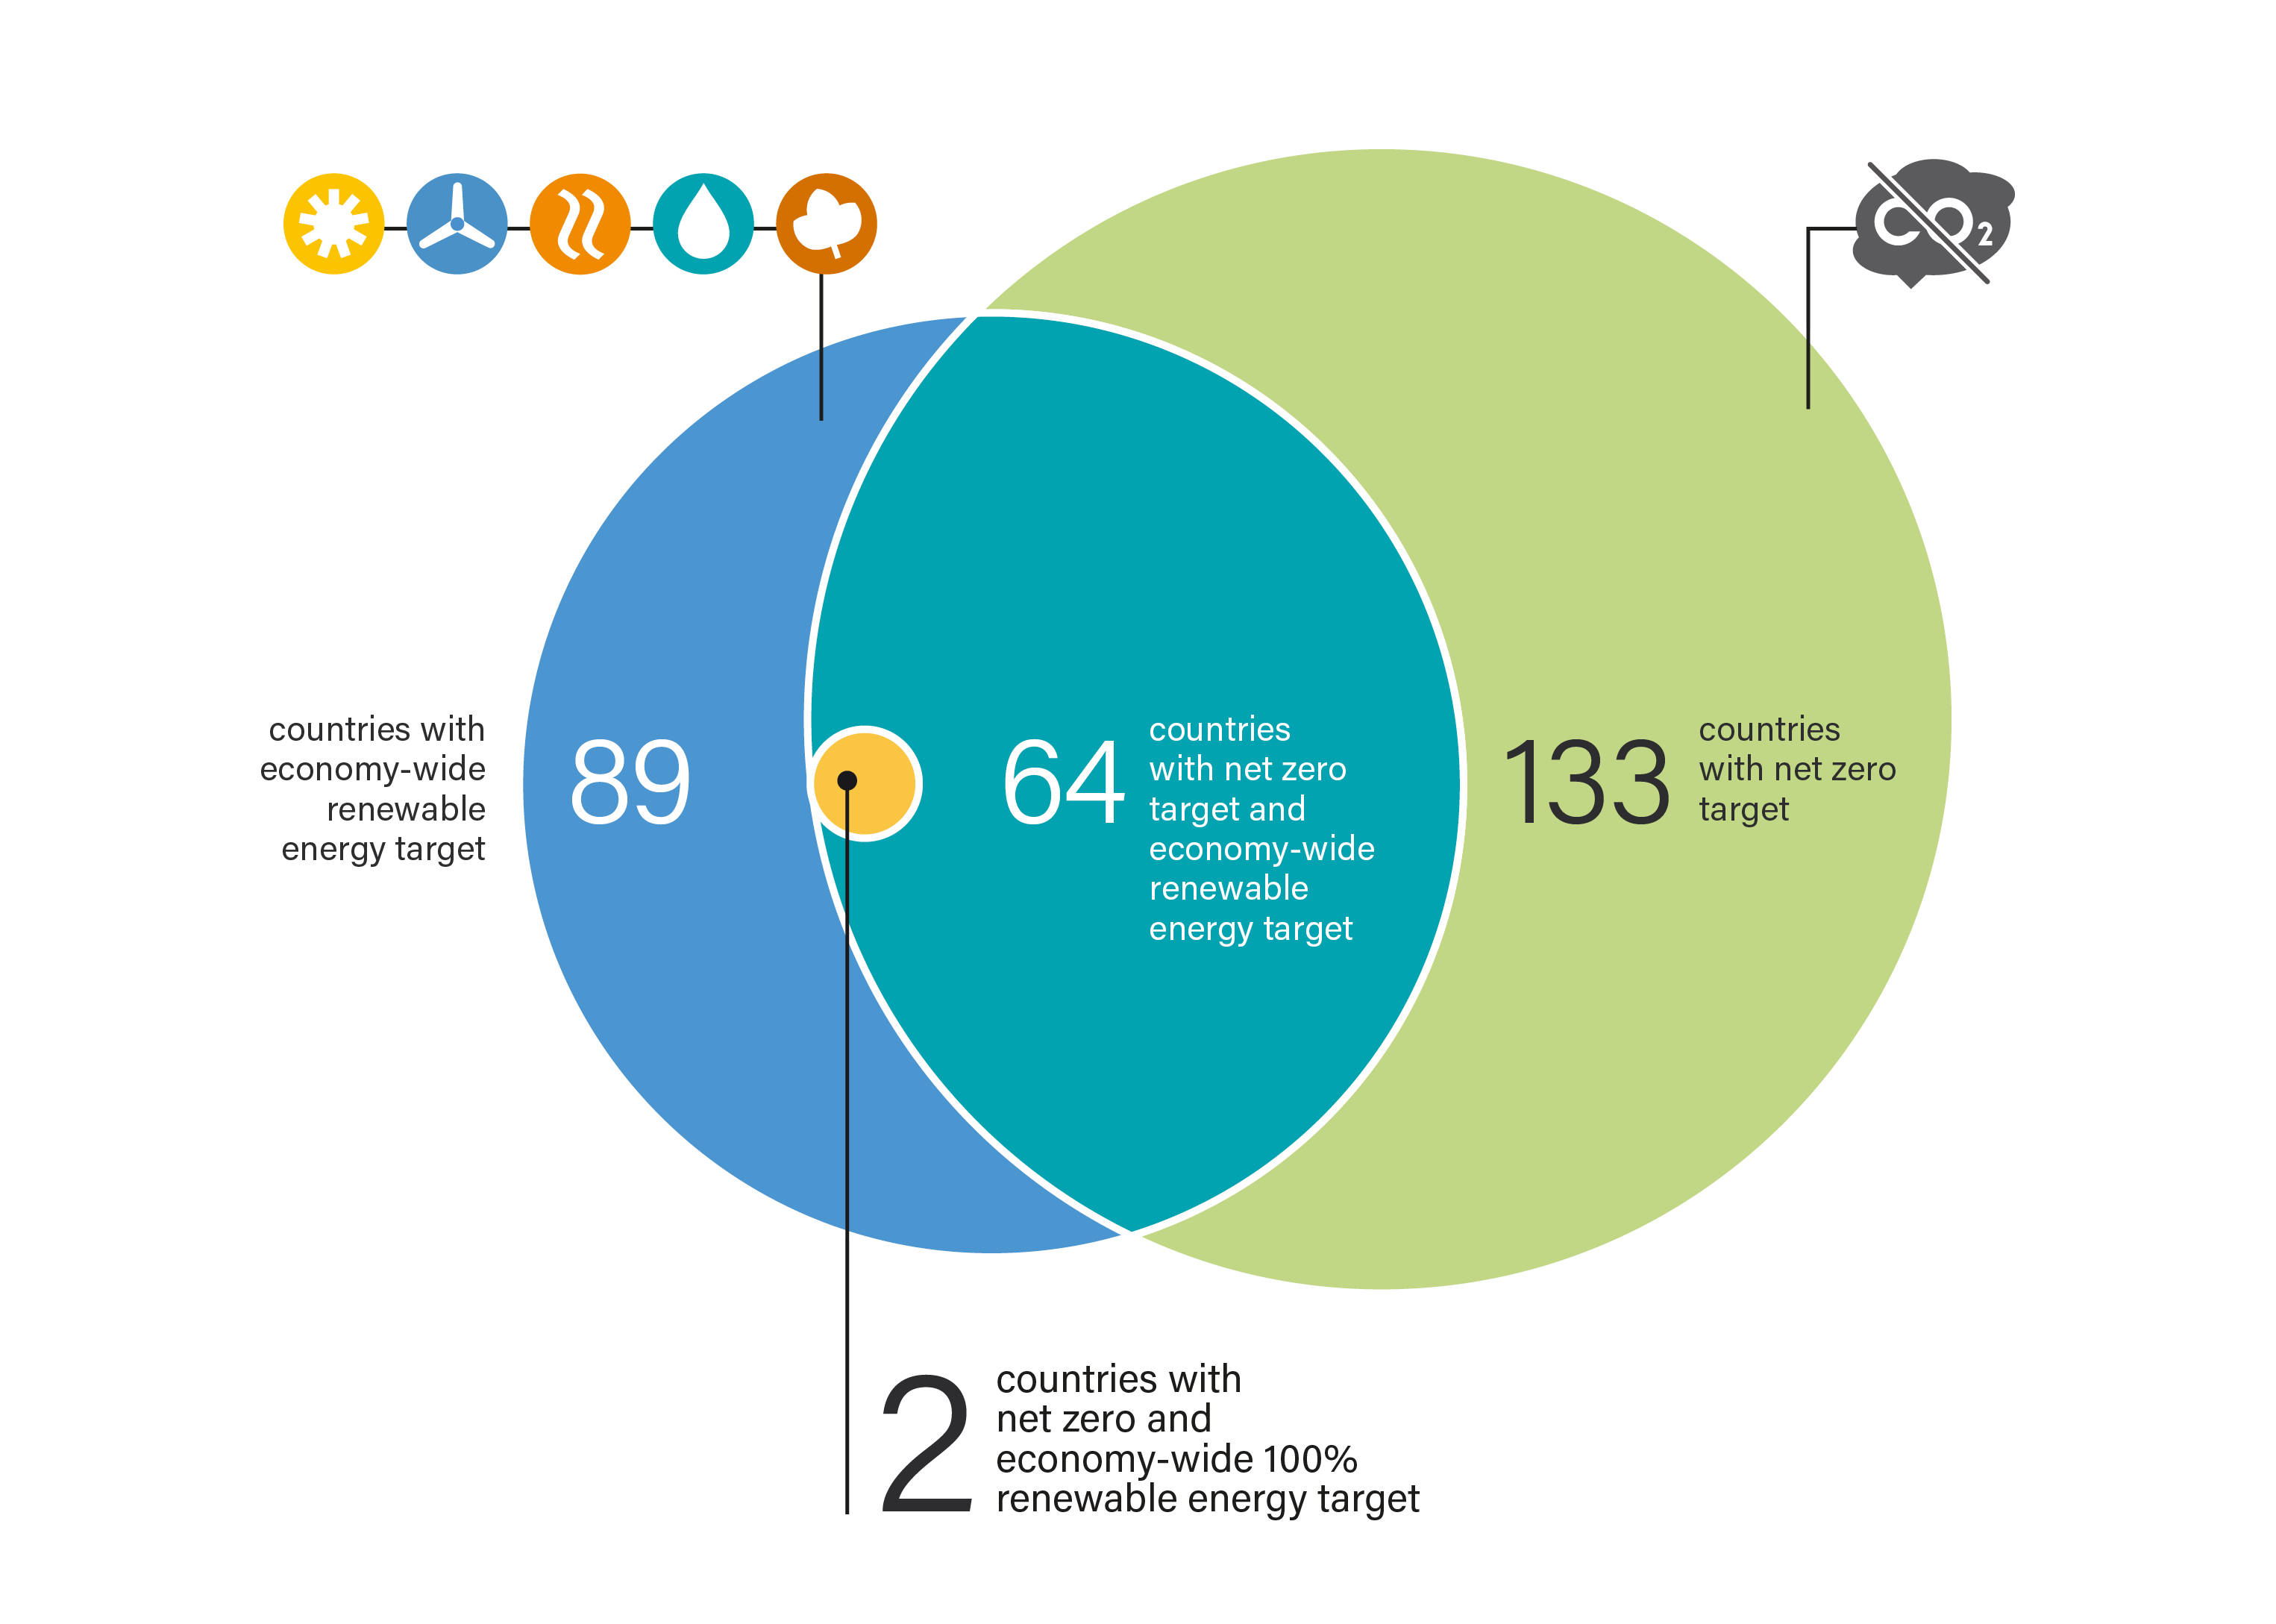
Meanwhile, as of 2024, 89 countries had enacted economy-wide renewable energy targets, and 64 countries had both net zero emission and economy-wide renewable energy targets. 36 (See Figure 6.) Only two countries had both net zero emission and 100% economy-wide renewable energy targets. 37 These two countries were Fiji and Nauru, both developing countries that are particularly vulnerable to climate impacts. 38
Despite continued global commitment and the growing number of net zero emission targets, setbacks have become apparent. Scotland, for example, eliminated its 2030 climate targets because they were considered to be unachievable, but kept in place targets for 2045. 39 Such revisions to near-term climate targets and delays in updating targets, combined with political and regulatory uncertainties, have continued to undermine implementation, increasingly affecting investor confidence. 40 Relatedly, the private sector sent mixed signals in 2024, with some new initiatives but also signs of backtracking among key actors. 41 (See Sidebar 3).
FIGURE 6 Countries with Net Zero Emission Targets and Renewable Energy Targets, as of 2024
Sidebar 3. PRIVATE SECTOR COMMITMENTS
Private sector engagement on climate and renewable energy showed mixed progress in 2024. Although new alliances and targets were announced, backsliding by key actors in energy, finance and manufacturing raised concerns about the credibility and durability of private climate and renewable energy leadership.
Several major banks withdrew from the Net Zero Banking Alliance during the year, highlighting growing tensions between fiduciary obligations and net zero commitments. Their departure undermined a key framework designed to align financial flows with the goals of the Paris Agreement.
The fossil fuel sector also rolled back commitments to renewable energy and climate alignment. Equinor, Shell and BP all scaled down their renewable energy strategies in 2024. Investor pressure to prioritise short-term returns, combined with shifting regulatory landscapes, pushed firms to reassert their focus on core fossil fuel operations.
Vehicle electrification is considered one of the key drivers of renewable energy uptake; however, several incumbent automakers in the transport sector have re-evaluated their timelines for this shift. Despite an overall increase in electric vehicle sales in 2024, the share of plug-in hybrid vehicles among these sales also grew, indicating a shift towards transitional technologies rather than full electrification. Slower-than-expected consumer uptake in some markets, coupled with regulatory uncertainty, led some firms to delay the phase-out of internal combustion engine models.
Despite these setbacks, some utilities and industrial companies reaffirmed renewable energy commitments. Several fossil fuel-dependent countries and companies launched the Climate Finance Action Fund to provide off-take agreement guarantees for small and medium-sized renewable energy producers, alongside first-loss capital for green industrial projects. The Utilities for Net Zero Alliance, launched at COP 28, updated its goals in April 2024. The alliance – led by the United Arab Emirates' grid operator TAQA, and also including UK-based National Grid, Italy's Enel, France's EDF and US-based groups such as Edison International – committed to increasing their “green energy” capacity to at least 749 GW by 2030 (a 250% increase from their renewables capacity in 2023).
However, other major utilities continued to invest in new coal and fossil gas infrastructure or to keep existing plants operating beyond scheduled retirements, indicating a lack of alignment with climate and energy transition objectives.
Source: See endnote 41.
RENEWABLE ENERGY TARGETS
Renewable energy targets are formal commitments that define clear goals to increase renewable energy within a set time frame, guiding policies and investments to drive uptake. 42 Showing little growth since 2023, 89 economy-wide renewable energy targets were in place in 2024, ranging from a 10.6% renewables share in Malta's energy supply to 100% renewable shares planned in Barbados, Comoros and Fiji by 2030. 43 Economy-wide renewable energy targets for 2050 ranged from 31% in Indonesia to 100% in the Philippines. 44
Six countries had targets for 100% renewables as of 2024: Barbados, Comoros, Fiji, Guyana, Nauru, and the Philippines, most of which are small island developing states (SIDS). 45 This reflects the high ambition on renewable energy among some of the countries that are most exposed to the impacts of climate change. 46
Indonesia, however, lowered its 2025 renewable energy target from 23% to between 17% and 19%. 47 In early 2025, the EU announced that it is far behind its 2030 renewable energy target of at least 42.5% and highlighted the need for accelerated efforts, with renewables making up only 24.5% of the EU energy mix in 2023. 48
Moreover, several specific targets were in place to support an increase in renewable energy supply across electricity, direct thermal energy (heat) and fuels in 2024. By year's end, 287 renewable energy targets across energy carriers were in place in 162 countries. 49 (See Figure 7.)
Additionally, 143 countries had in place renewable electricity targets as of 2024, ranging from a 10% target for 2030 in Ghana to 100% targets for 2030 in Barbados, Denmark, Kenya, and Tuvalu, among other countries. 50 A total of 35 countries had targets for direct renewable heat (thermal energy), ranging from 7% by 2030 in Georgia to 67.5% by 2030 in Lithuania. 51 Twenty countries had in place renewable fuel targets in 2024, mostly biofuel blending mandates, ranging from 7% by 2030 in the Netherlands to 34% by 2030 in Finland. 52 The uneven distribution across renewable power, heat and fuel targets shows that renewable energy policy attention remains concentrated on the power sector, with limited focus on renewable heat and fuels.
As of 2024, only nine countries had targets for all mentioned renewable energy carriers , all in the EU. 53 Most countries (83) had a target in place for only one renewable energy carrier. 54 Only Romania enacted a new economy-wide renewable energy target during the year; only the Czech Republic, Ukraine and Uzbekistan enacted new renewable power targets; and only Cambodia and Poland announced new renewable power targets. 55 Both Montenegro and Ukraine enacted renewable heat targets, while Slovenia announced a renewable heat target. 56 Revised, more ambitious biofuel targets were announced and/or enacted in Japan, the Philippines and Poland in 2024. 57
FIGURE 7 Renewable Energy Targets, by Country by Energy Carrier and in Total Final Energy Consumption, as of 2024
Despite the global goal set at COP 28 to triple the world's renewable power capacity by 2030, existing national plans and targets are projected to deliver only half of the necessary expansion. 58 This translates to a projected shortfall of 3.8 terawatts, or 34%, based on existing policy trajectories. 59 Of the major renewable energy technologies, only solar PV is on track to meet the required levels of growth. 60 Supported by more robust policy implementation, deployment of all other renewable technologies will need to accelerate substantially to contribute meaningfully to global goals. 61
In 2024, targets continued to play a central role in driving renewable energy consumption in end-use sectors. However, whereas 89 countries had economy-wide renewable energy targets in 2024, only 27 countries had sectoral targets for renewables during the year. 62 (See Figure 8.) This included 23 countries with targets for renewable energy shares in the transport sector, with 2030 targets ranging from 13.4% in Greece and 14% in Estonia and Hungary to 40% in China and Iceland. 63 Five countries had renewable energy targets for buildings in 2024, ranging from 50% in Viet Nam to 68% in Latvia, both set for 2030. 64 Equally, five countries had targets for industry, ranging from 27% by 2030 in Italy to 64.9% by 2030 in Latvia. 65 No renewable energy targets were in place in the agricultural sector in 2024, indicating uneven policy attention across sectors. 66
FIGURE 8 Renewable Energy Targets, by Country and Sector, as of 2024
Only a few new sectoral targets were enacted in 2024, including Latvia's target for nearly 65% renewables in industrial energy consumption by 2030. 67 In the buildings sector, Germany enacted a new renewable energy target based on its Building Energy Act, which requires newly installed heating systems to use 65% renewables. 68 Meanwhile, seven countries enacted new renewable energy targets in the transport sector in 2024 (ranging from 15% to 30% renewable shares); all of these countries were EU Member States, which enacted the targets as part of the 2024 updates to their 10-year national energy and climate plans for 2021-2030. 69
Mokrice hydropower plant near Brezice, Slovenia
POLICY MECHANISMS
Beyond setting national targets, governments use various policy tools to stimulate renewable energy demand and guide progress towards achieving ambitions. These include feed-in tariffs (FITs), net metering and net billing, auctions and tenders, mandates such as renewable portfolio standards (RPS), and hybrid system incentives. 70
Net metering was the leading policy tool in 2024, in place in 61 countries, including 19 that combined it with feed-in tariffs.
Policies such as feed-in tariffs, net metering and net billing v , which create incentives for renewable energy producers and help facilitate their participation in the energy system, received continued policy attention in 2024. During the year, 116 of these policies were in place across 93 countries. 71 (See Figure 9.) This included 44 countries with feed-in tariffs, 61 countries with net metering policies, and 11 countries with net billing policies. 72 23 countries implemented feed-in tariffs alongside other support mechanisms; among them, 19 combined feed-in tariffs with net metering, while four (France, Greece, Moldova, and Poland) combined feed-in tariffs with net billing policies. 73
FIGURE 9 Renewable Energy Feed-In Tariffs, Net Metering and Net Billing Policies by Country, as of 2024
Several new incentive policies were announced and enacted in 2024, with five countries – Greece, Japan, the Netherlands, Poland and Ukraine – announcing and enacting new feed-in tariffs. 74 In a further five countries – Bosnia and Herzegovina, Cyprus, Denmark, North Macedonia and the United Kingdom – feed-in tariff schemes were closed to new applicants, but existing contracts remained in force. 75 Four countries – Greece, Jamaica, South Africa and Spain – enacted new net billing schemes, and Lithuania shifted from net metering to net billing in 2024. 76 In total, six countries have transitioned from net metering to net billing in recent years: Jamaica, Latvia, Lithuania, Portugal, South Africa and Spain. 77 Cambodia and Malaysia enacted new net metering schemes in 2024. 78
Policy efforts in 2024 increasingly focused on accelerating project permitting and enhancing renewable electricity integration into the electric grid, reflecting the growing global ambition to improve grid and storage infrastructure, a key barrier to the deployment of renewable power capacity in recent years. 79 (See Energy Systems and Infrastructure section.) The increase in hybrid solar-wind systems in India provides a clear example of how hybrid system incentives can drive the uptake of renewables while enhancing grid integration. 80 (See Snapshot India).
Although only 27 countries had sectoral targets for renewables in 2024, 68 countries had regulations or incentives for renewables in end-use sectors.
Besides policies that support the increase of renewable energy supply, 69 countries had regulations and fiscal or financial incentives targeting end-use sectors in place in 2024. 81 Out of these, only five countries addressed all four major end-use sectors, reflecting a lack of cross-sectoral approaches to the uptake of renewables. 82 Policies mandating biofuel blending in transport, as well as subsidies, rebates and tax exemptions that encouraged the integration of renewable energy systems in buildings, continued to be primary drivers for increasing renewable energy use in end-use sectors. 83 Agriculture and industry garnered less policy attention. 84 (See Renewables in Energy Demand section.)
Eight countries adopted new policy measures to support renewables in the buildings sector in 2024, and most of them were subsidies for rooftop solar PV. 85 Six countries – Austria, Belgium, Brazil, France, Norway and Poland– introduced new transport sector policies, primarily implementing new biofuel blending mandates or tax exemptions. 86 Canada, China, France, India and Slovenia implemented mechanisms to encourage renewable energy uptake in the industrial sector, including subsidies and tenders. 87 Italy, Morocco and Portugal launched subsidy schemes for the agricultural sector in 2024, supporting agrivoltaics and solar pumping kits. 88
In 2024 and early 2025, some policies promoting renewable energy adoption were rolled back, including the incoming US administration's reversal of a 2024 rule that had reduced fees by approximately 80% for wind and solar projects on federal lands. 89 At the same time, fossil fuel bans were repealed or relaxed across different sectors, indicating a retreat from climate and renewable energy commitments. New Zealand lifted its ban on offshore oil and fossil gas exploration and removed incentives for electric vehicles. 90 In early 2025, the United Kingdom announced it would abandon its plan to ban the sale of new gas boilers by 2035, a policy initially introduced by the previous Conservative administration to reduce carbon emissions from home heating. 91 Few governments have enacted their announced bans on internal combustion engine (ICE) vehicle sales, and several have scaled back or delayed these plans, such as the EU allowing ICE cars with CO2-neutral fuels beyond 2035. 92
Trade policies related to renewable energy and enabling technologies have increased sharply in recent years. 93 In 2015, only nine formal trade measures related to renewables and enabling technologies were in place; by 2024, this number had surged to 212, doubling from 2022 and including measures related to solar PV (more than 50 policies), battery components (more than 50), electric vehicles (47), wind turbines (32) and heat pumps (16). 94 Nearly 40% of new trade policies since 2020 involved tariff changes, anti-dumping measures and countervailing duties, while half of energy-related critical minerals are regulated by export controls. 95 Over the same period, around 50 new free trade agreements were signed, most of them maintaining preferential tariffs for renewables and enabling technologies. 96

Snapshot India
Hybrid solar and wind energy systems surging
In the first half of 2024, hybrid solar PV and onshore wind energy systems represented 40% of the total awarded renewable energy capacity in India. These systems involve the co-location of solar PV, onshore wind and often battery storage technologies. They are attractive for electricity utilities and corporate buyers of power purchase agreements because they help reduce the variability in electricity generation and facilitate the integration of renewables into the grid.

According to the International Energy Agency, India is a pioneer in promoting hybrid renewable power plants and can provide useful lessons for other countries seeking to minimise the impacts of variable renewable energy on their electricity network infrastructure. The overall awarded capacity for hybrid systems in India more than doubled from around 5 GW in 2023 to around 12 GW in just the first half of 2024. This represents a significant acceleration in annual growth following the launch of a solar-wind hybrid policy in 2018 by India's Ministry of New and Renewable Energy.
The goal of the policy was to establish a framework to promote large-scale, grid-connected wind-solar PV hybrid systems and to provide incentives to developers. Solar-wind hybrid systems have numerous benefits, including:
efficient use of transmission infrastructure and land;
increased capacity utilisation factors (CUF) compared to stand-alone solar PV and onshore wind plants;
lower variability in generation due to complementary generation profiles (i.e., generating electricity from solar during the day and from wind at night); and
cost-competitive tariffs compared to stand-alone wind power systems.
Hybrid solar-wind systems represented 40% of the total awarded renewables capacity in India in the first half of 2024.
India's solar-wind hybrid policy also permits the use of battery storage to provide more reliable and balanced power output. Several state governments in India have announced their own policies and incentives to promote hybrid projects. A study from Ember found that the tariff rates for hybrid projects in India range in between those for solar and wind projects.
For a 1,350 megawatt (MW) auctioned wind capacity (closed bidding), tariffs were in the range of INR 3.60-3.70 (USD 0.042-0.043) per kilowatt-hour (kWh), with a minimum CUF requirement of 22%.
For a 1,200 MW auctioned wind-solar hybrid capacity, discovered tariffs were in the range of INR 3.43-3.46 (USD 0.040-0.041) per kWh, with a minimum CUF requirement of 30%.
For a 1,200 MW auctioned solar capacity, discovered tariffs were INR 2.48 (USD 0.029) per kWh, with a minimum CUF requirement of 17%.
In India, hybrid projects with battery storage or with firm and dispatchable renewable energy commitments have higher tariffs in the range of INR 3.5-5.6 (USD 0.041-0.066) per kWh. The falling prices of batteries are expected to drive down the cost of these hybrid systems. Meanwhile, higher tariffs through the integration of battery storage will need to be weighed against the benefits of more reliable and balanced output.
Key challenges faced in installing hybrid systems include land constraints (given that many of India's high-potential wind sites have been saturated), grid integration challenges and the lack of a skilled workforce to execute the systems. Despite these constraints, hybrid systems are expected to grow further, with estimates of 30 GW of projects in the pipeline in India as of September 2024.
Source: See endnote 80 for this section.
i Net metering typically credits surplus electricity at the full retail rate, offsetting consumption on a one-to-one basis, whereas net billing compensates exports at a lower rate – such as the wholesale or avoided cost – and separates billing for consumption and generation.
ii The data in this section draw from the REN21 Policy Database. Developed and regularly updated by REN21, the database tracks renewable energy targets and policies across sectors and policy types, primarily at the national level, to support the analysis of ambition and implementation. The REN21 Policy Database is currently being expanded to enhance coverage across governance levels (including sub-national levels) and end-use sectors.
iii Global subsidies for fossil fuels include the fiscal cost of support for fossil fuels through three support mechanisms: direct transfers, tax expenditures, and price support, based on combined data from the Organisation for Economic Co-operation and Development (OECD) and the International Energy Agency.
vi To qualify as a new submission in the 2025 round, an NDC must define its contribution with a 2035 time frame. Countries that submitted their 2025 NDC updates by May 2025 were: Andorra, Brazil, Canada, Cuba, Ecuador, Japan, Kenya, Maldives, Marshall Islands, Montenegro, Nepal, New Zealand, the Republic of Moldova, Saint Lucia, Singapore, Switzerland, the United Kingdom, the United Arab Emirates, Uruguay, the United States, Zambia and Zimbabwe.
v Other countries with relatively high carbon tax rates in 2024 included Sweden (USD 127 per tonne of CO2), Norway (USD 108 per tonne of CO2 equivalent) and Finland (USD 100 per tonne of CO2). The lowest carbon tax rates in 2024 were in Japan (USD 1.91 per tonne of CO2), Argentina (USD 0.81 per tonne of CO2 equivalent) and Ukraine (0.77 per tonne of CO2).See endnote 30.

Investment and Finance
Renewable Energy
In 2024, global investment in renewable energy and enabling technologies reached a record USD 2.1 trillion, an 13% increase from the previous year. 1 Of this, renewable energy investment amounted to USD 728 billion, up 8% for the year but below the double-digit growth rates of 2023 (19%) and 2022 (23%). 2 Much of the overall investment continued to be in solar power and electric vehicles, highlighting a funding imbalance across the technologies. Global investment in renewables remains well short of what is needed. At just 48% of the annual investment level required through 2030, the world remains off track to reach net zero greenhouse gas emissions by 2050. 3
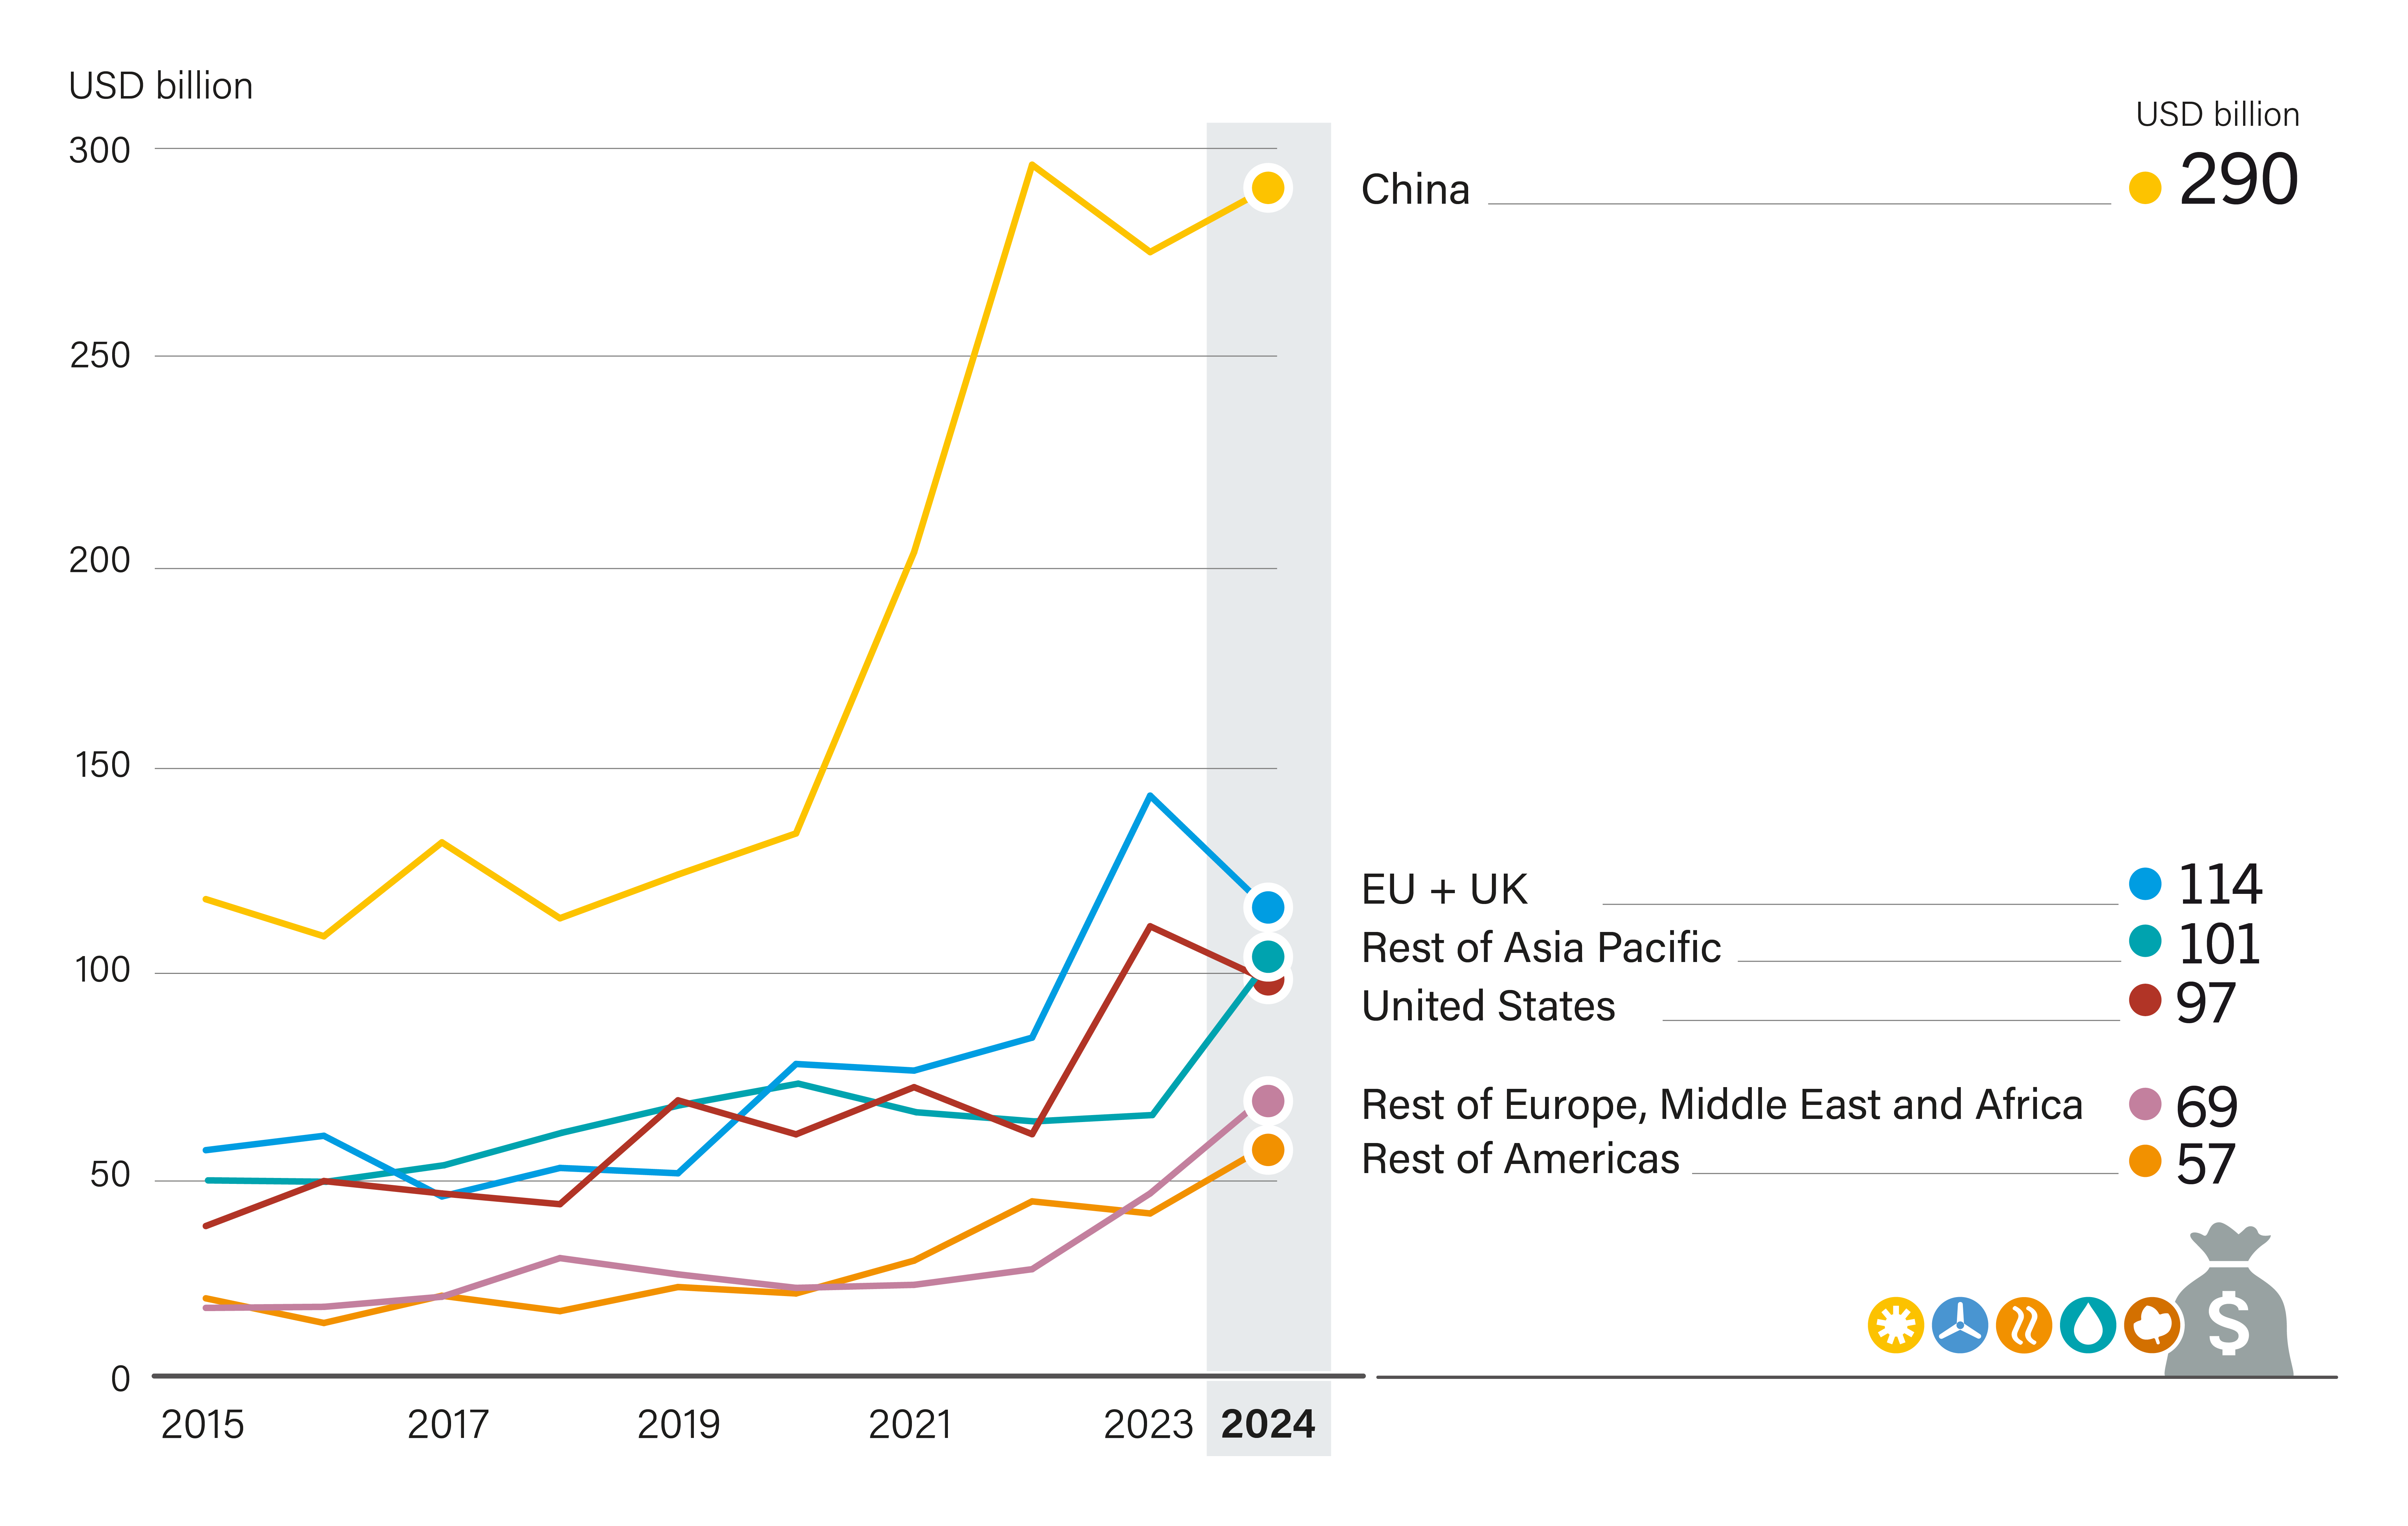
Regional trends in renewable energy investment reveal significant disparities. 4 (See Figure 10.) Between 2015 and 2024, China consistently led global renewable energy investment, peaking at over USD 290 billion in 2024 and accounting for the largest share each year. 5 Investment in the European Union (EU) and the United Kingdom surged in 2023 but dropped significantly in 2024, falling from USD 142 billion to USD 114 billion. 6 Similarly, US investment peaked at USD 110 billion in 2023 before declining to around USD 97 billion in 2024, while growth in the rest of Asia, Africa and the Middle East continued to accelerate. 7
FIGURE 10 Global Investment in Renewable Power and Fuels, by Country and Region, 2015-2024
Despite the strong emphasis on industrial policy support, spending on renewable energy and enabling technologies supply chains fell slightly from USD 145 billion in 2023 to USD 140 billion in 2024. 8 This decline reflects growing caution in the market, particularly within the solar photovoltaic (PV) sector, where oversupply has become a critical issue. 9 Global solar PV manufacturing capacity was expected to surpass 1,100 gigawatts (GW) by the end of 2024 – more than double the current demand. 10 As a result, module prices have more than halved since early 2023, pushing many solar PV manufacturers into negative net margins. 11 These challenging conditions have led to the cancellation of around 300 GW of planned polysilicon manufacturing capacity and 200 GW of wafer manufacturing projects, representing an estimated USD 25 billion in lost investment. 12
728USD billion total investment in renewable power and fuels in 2024.
A significant barrier to accelerating renewable energy deployment in emerging and developing economies is the persistently high cost of capital. 13 For utility-scale solar PV and wind energy projects, the weighted average cost of capital in these regions is often more than twice that in advanced economies. 14 (See Figure 11.) This disparity arises from factors including political and economic instability, currency risks, and underdeveloped financial markets, which collectively elevate the perceived investment risk. 15 Consequently, financing costs constitute a substantial portion of the levelised cost of electricity in these countries, making renewable energy projects less financially viable and hindering their implementation. 16
FIGURE 11 Weighted Average Cost of Capital for Onshore Wind Power and Solar PV, by Country Income Level, 2022-2024

Reducing the cost of capital in emerging and developing economies can greatly lower the overall financing costs of renewable energy projects. 17 A one percentage point reduction in the cost of capital could reduce the financing cost of achieving net zero by USD 150 billion per year. 18 In countries such as Kenya and Senegal, high interest rates and currency risks make financing renewable energy much more expensive than in advanced economies. 19 Without targeted policy and financial interventions, such regions risk being left behind in the global energy transition. 20
72% was the share of solar PV of global renewable investment in 2024.
Technology-specific trends reveal a mixed picture. 21 Annual investment in solar PV surged 22% in 2024 to reach USD 521 billion, outpacing the 20% growth in 2023 and underscoring solar's continued dominance in the energy transition. 22 (See Figure 12.) A major shift in 2024 was the expansion of small-scale PV, which accounted for more than half of total solar PV investment. 23 Pakistan alone installed 12.5 GW of unsubsidised rooftop solar, reflecting a growing trend towards decentralised generation. 24 In Brazil and the United States, despite record capacity additions, solar investment fell due to declining module costs. 25 The falling cost per installed unit meant that even though more solar capacity was added, the total capital expenditure was lower. 26 In the EU, solar investment stagnated as lower electricity prices made residential solar less attractive, limiting adoption in Germany, France and other major European markets. 27
In contrast to solar PV, wind energy investment dropped around 15% in 2024 to its lowest level since 2021. 28 This decline reflects persistent permitting challenges, supply chain constraints and uncertain policy signals in several major markets. During 2023 and 2024, several offshore wind projects in the United States and Europe defaulted due to unhedged costs and revenue-support schemes that were not adapted rapidly to external market conditions. 29 Renegotiations of offtake deals put projects at risk of further delays. 30
x2 cost of capital in emerging and developing economies compared to advanced economies.
The cost of wind energy materials, labour and logistics has increased due to strong demand and constrained supply in the wake of the COVID-19 pandemic. 31 The global economic fallout from the Russian Federation's invasion of Ukraine in 2022 raised overall project capital expenditures for most developers globally. 32 The rising costs of raw materials and components required for turbine production have increased both the manufacturing and upkeep costs that manufacturers need to bear. 33 These price increases have put additional pressure on developers who are already operating with narrow profit margins and are constrained by wider project economics.
The US offshore wind industry has faced a perfect storm of rising costs, permitting delays and grid connection hurdles – all leading to low returns. 34 Inflation and supply chain challenges have driven up capital expenditures, and financing costs have spiralled due to rising interest rates. 35 Some developers have sought to renegotiate their previously agreed offtake deals, which are no longer profitable, while others have tried to cancel their contracts altogether. 36
After a period of relative stagnation, global investment in liquid biofuels increased in both 2023 and 2024. 37 Most of this investment was in hydrotreated vegetable oil (HVO) production capacity, as well as conventional ethanol in Brazil and India.38 In addition to ethanol for road fuel, investments gained momentum in the use of ethanol as aviation fuel (alcohol-to-jet), mainly in the United States.39 Among the leading companies, BP had the largest announced production capacity in its pipeline – a combined 130,000 barrels per day of ethanol and HVO and sustainable aviation fuel (SAF) capacity – positioning BP as a global frontrunner in bioenergy. 40 Other oil majors, including Chevron, Eni, ExxonMobil, Shell, and TotalEnergies, also made large strides, particularly with advanced biofuels, although many projects are still in development. 41
Despite a 7% overall decline in the global solar thermal market in 2023, due mainly to a 7.7% drop in China, notable growth occurred in some areas. 42 In India, also a solar thermal leader, the market grew 27%. 43 Interest has risen as well in southern Africa and Latin America, with solar thermal growth reported in Mozambique (40%), South Africa (12%), Mexico (5%) and Brazil (3%). 44
The rising prominence of nuclear energy presents another shift in the energy investment landscape. This risks diverting capital from renewable energy efforts, potentially crowding out the broader renewables agenda.
Despite broader market gains, renewable energy companies experienced plummeting stock values in late 2024 amid fears that the incoming US administration could enact policies eroding the competitiveness of renewables. 45 Market dynamics have added to the uncertainty. 46 The demand outlook for renewable energy technologies is clouded by volatile pricing, supply chain overcapacity and investor scepticism. 47 Large energy companies, including BP, have contributed to this trend by scaling back their renewable energy strategies and redirecting investment towards fossil fuels. 48 (See Sidebar 4). Meanwhile, private investors, including major hedge funds, have expressed waning interest in clean energy due to concerns about profitability and political risk, with some declaring that “clean is dead for now”. 49
22% was the growth in solar PV related investment in 2024.
In addition, there has been growing uncertainty about the future availability of international climate finance. Policy shifts – such as the possible loss or redirection of financing for the US Agency for International Development and various climate-related funds – pose a serious threat to renewable energy initiatives in developing countries. 50 A lack of clarity on the future of tariffs and tax credits triggered steep declines in funding and investment for renewables in early 2025. 51
Energy Efficiency and Enabling Technologies
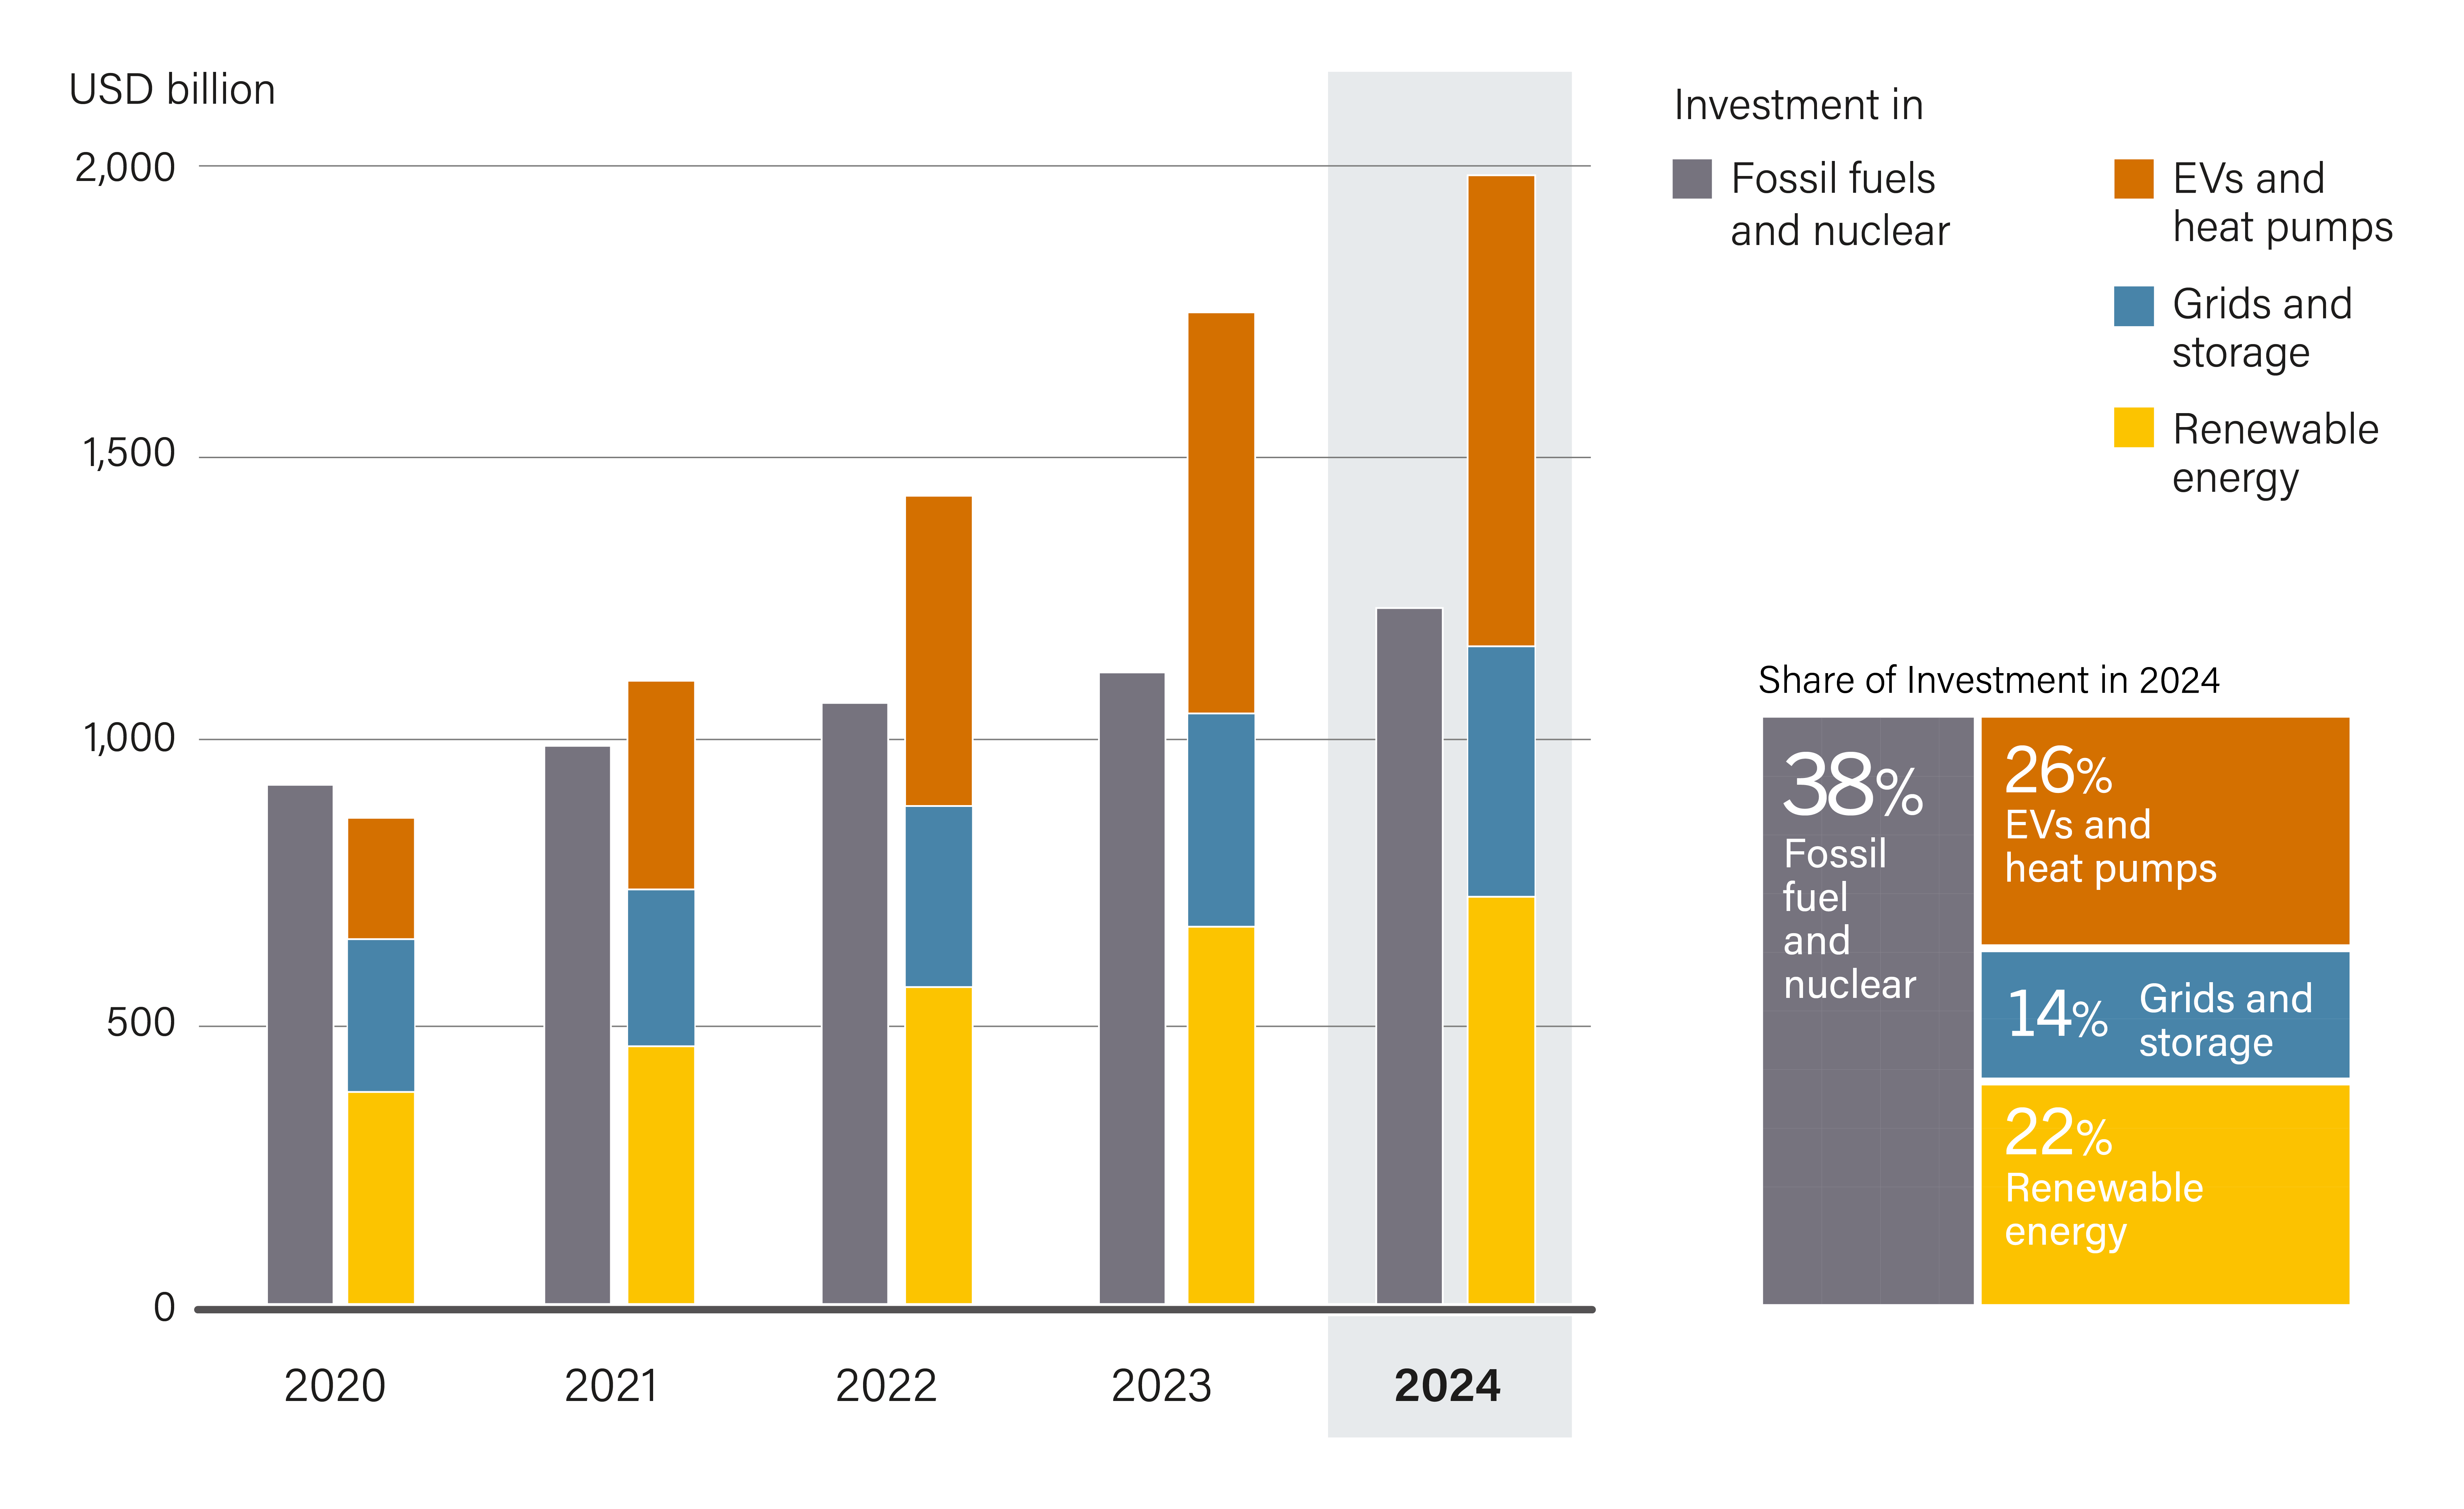
Investment in energy efficiency and enabling technologies was an estimated USD 871 billion in 2024, a 12% increase from 2023. 52 This was driven mainly by a 20% increase in investment in electrified transport i , which reached USD 747 billion and surpassed investment in renewables. 53 Markets for other technologies slowed, with heat pump investments declining 5%, hydrogen falling 42% and clean industry ii plummeting 50%. 54 However, between 2020 and 2024, electrification of end-uses experienced the fastest growth. 55 During the same period, investments in fossil fuels and nuclear energy also grew but at a slower rate; their relative share in total energy investment declined, reflecting a broader trend towards renewable energy and enabling technologies. 56 (See Figure 14.)
FIGURE 12 Global Investment in Renewable Power and Fuels, by Technology, 2015-2024

Sidebar 4. Oil and Gas Profits Take Priority Over Climate Commitments
Over the past decade, oil and gas companies have faced growing financial as well as social, legal and political pressure to reduce their greenhouse gas emissions. In the financial sphere, shareholder activism and stricter lending policies by European and US banks have had a measurable impact on the investments of publicly traded oil and gas companies, which comprise roughly one-third of the total equity value of the industry (the remainder being state-owned and private companies).
In response to this pressure, some oil and gas companies began investing in areas outside their core businesses, although this share of total investment has remained small. As of 2024, around 20% of oil and gas production came from companies that aimed to diversify their activities into “clean energy”, which may include renewable energy, carbon capture and storage, low-emission fuels and electric vehicle charging.
FIGURE 13 Low-Carbon and Total Capital Expenditures by Major Energy Companies, 2024
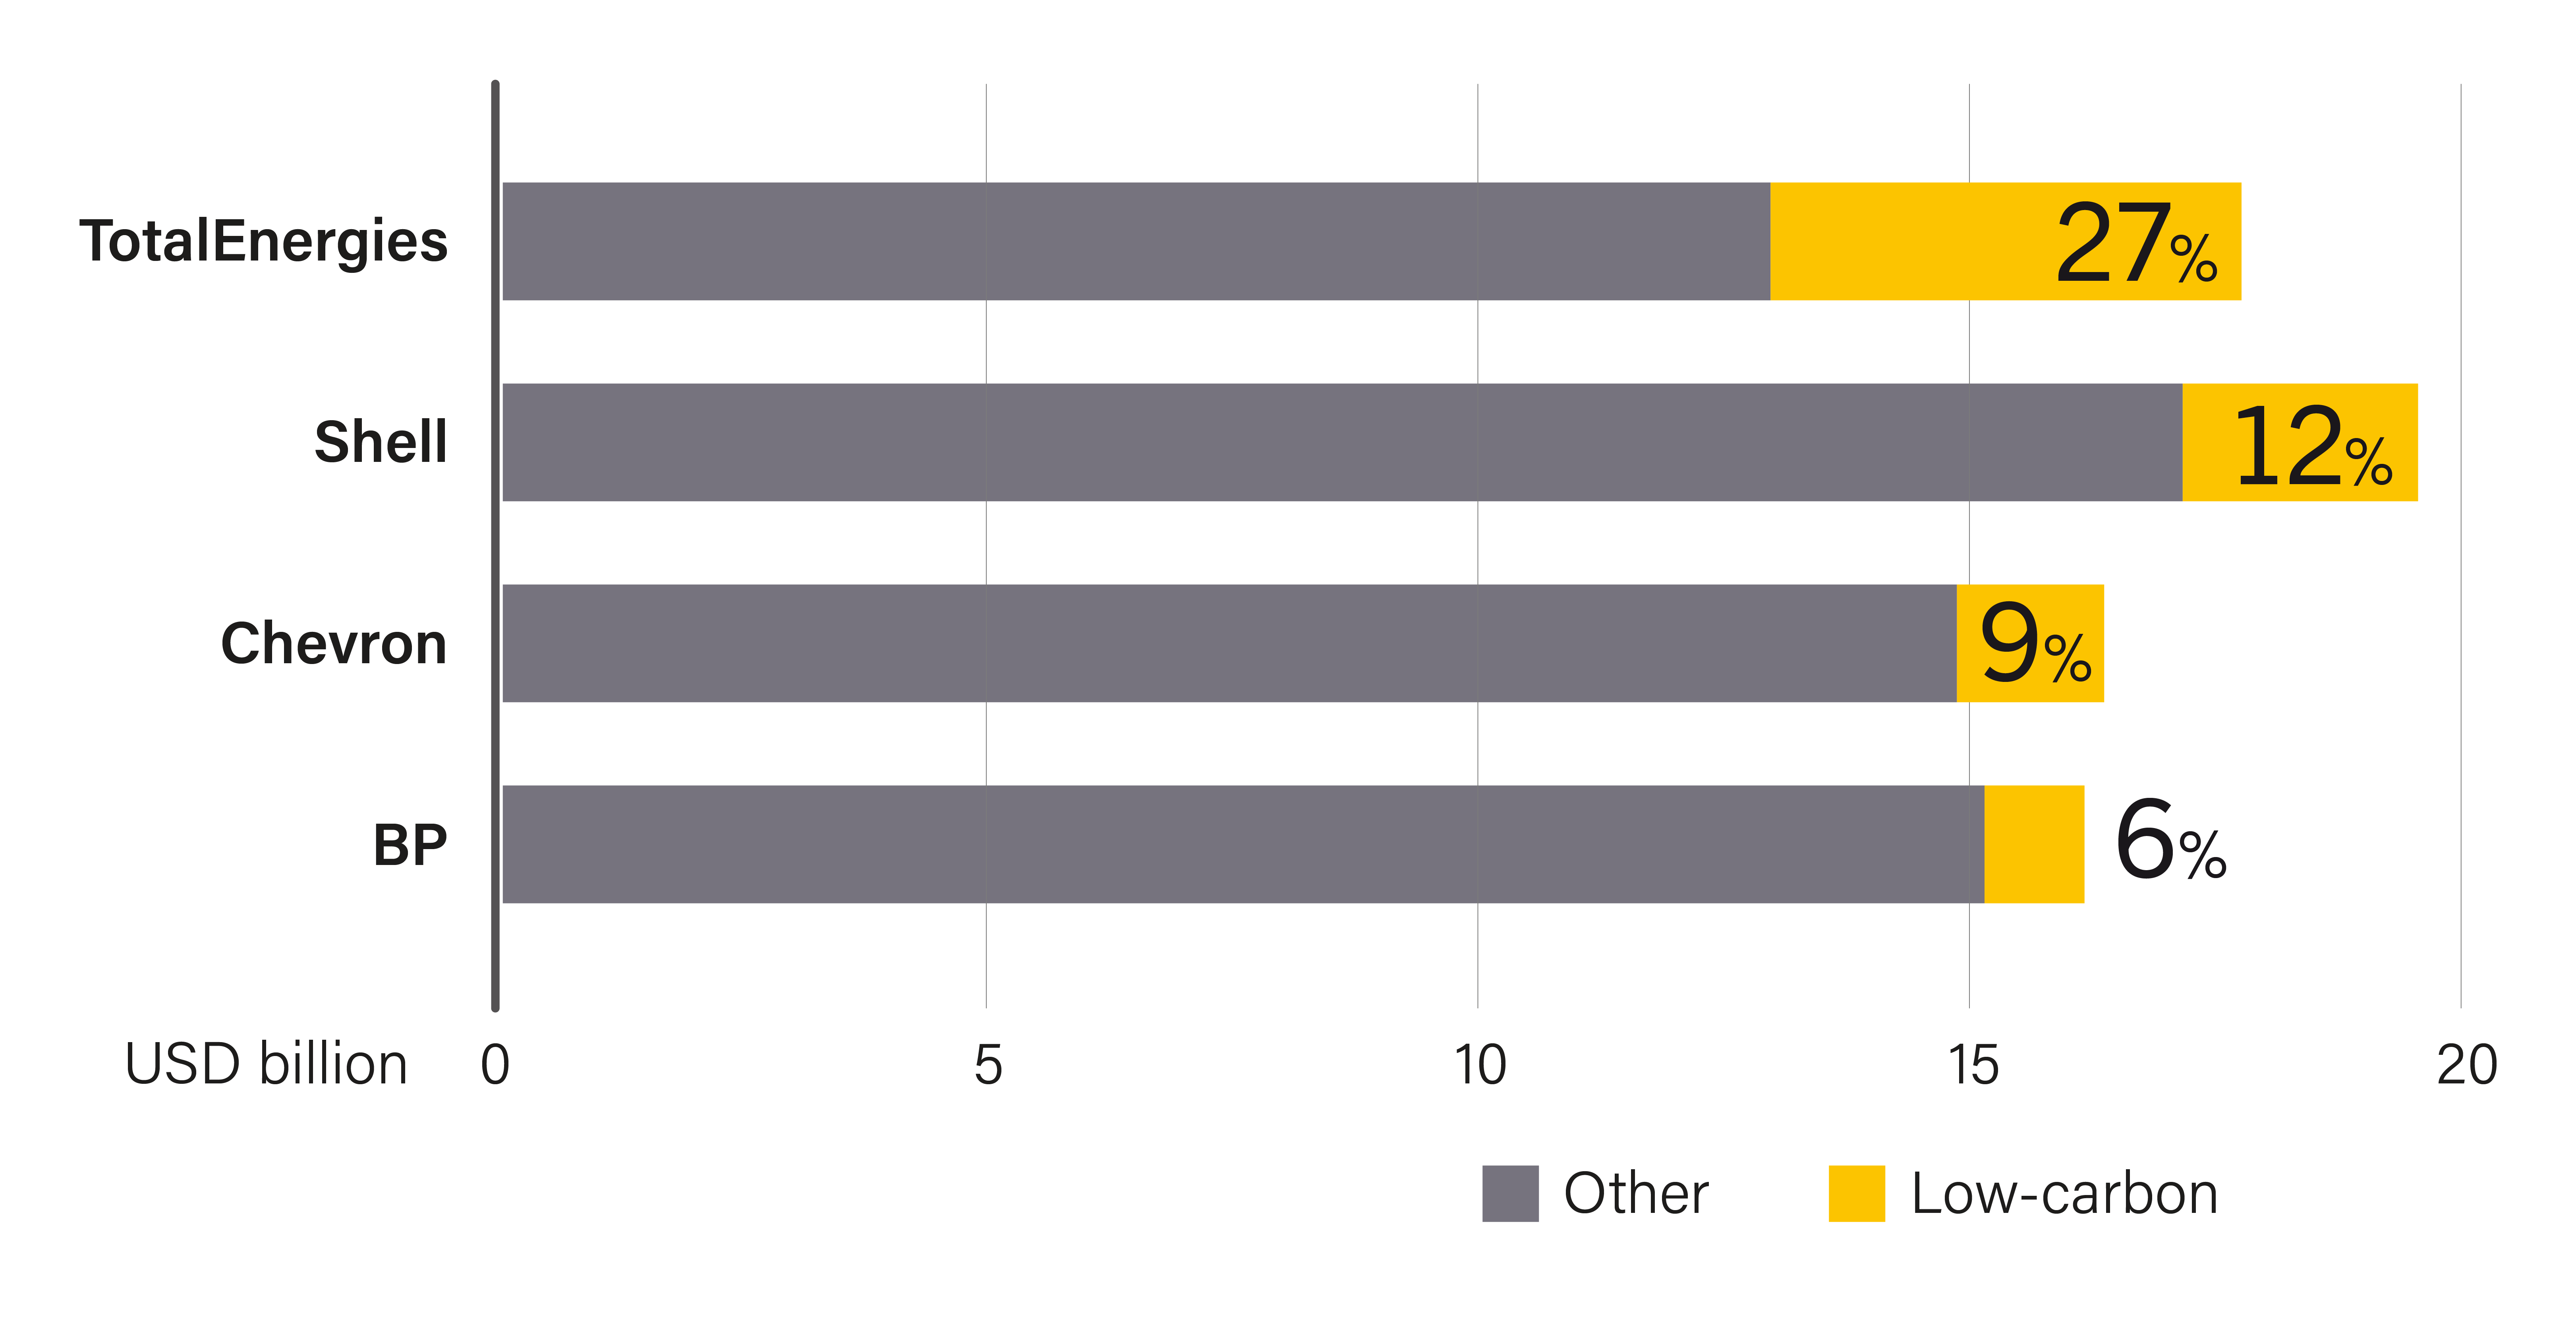
TotalEnergies, Equinor, Shell and BP led the charge, together accounting for more than 60% of such investment by oil companies. Between 2020 and 2024, these companies consistently invested 5-15% of their total capital in low-carbon options (See Figure 13), including renewables, with TotalEnergies investing nearly a third of its capital expenditure in this sector in 2023. Companies that invested smaller shares in low-carbon activities included CNPC, ConocoPhillips and Qatar Energy.
Since early 2024, many oil and gas companies that had been pro-active in the energy transition began to slow and even reverse their commitments. In February 2025, Norway's Equinor announced that it was dropping its renewable energy spending targets and halving its investments in renewables. Similarly, BP announced in 2025 that it would cut its annual investment in renewable energy businesses to between USD 1.5 and USD 2 billion per year.
Profitability is a key consideration, as fossil fuels have continued to produce a higher return than renewables. The internal rate of return iii for investment in oil and gas projects is expected to be around 20% (depending on the price of oil), whereas renewable energy projects provide single-digit returns of closer to 6-8%. Stock values have also underperformed for oil and gas companies that invested more heavily in renewables. For example, BP's stock value fell 10% after the company's preliminary investment in the energy transition, whereas companies that did not make the shift saw thriving stock prices in the same period (with Chevron and ExxonMobil up 46% and 57%, respectively). Geopolitical disruptions (such as the Russian Federation's invasion of Ukraine and a slowing of clean energy policies) further weakened company incentives to prioritise the energy transition.
Despite the backsliding trend, a few oil giants spurred new movement in the renewables sphere in 2024. Saudi Aramco, the world's biggest oil company, allocated 10% of its annual USD 50 billion capital expenditure to renewable energy projects that year. Chevron, the world's third largest oil and gas company, announced a new USD 500 million fund for low-carbon solutions including industrial decarbonisation, emerging mobility and energy decentralisation. The second biggest oil company globally, ExxonMobil, has consistently avoided investments in renewable energy, although it has placed some focus on carbon capture and storage, hydrogen and lithium.
i The internal rate of return describes the money a company will make off of the capital it invests in a project.
Global demand for heat pumps weakened in early 2024, although some regions may have reached a turning point. 57 Sales in China grew 13% in the first few months of 2024 – the second consecutive year of double-digit growth – consolidating its position as the largest domestic heat pump market (30% of the global total). 58 In the United States, the second largest market, sales fell 1% in the first half of the year, and in the EU they fell nearly 50%. 59 Factors contributing to the decline in European heat pump sales included falling natural gas prices, a slowdown in the construction sector (with a large share of heat pumps installed in new buildings) and an uncertain political and regulatory landscape. 60
Investment in clean industry projects iv fell nearly 50% in 2024. 61 Clean steel projects took the biggest hit in financial commitments, with investment falling to around USD 17.3 billion, down from USD 40.2 billion in 2023. 62 Green hydrogen made from renewables remained costly and in scarce supply, and some producers (such as Europe's ArcelorMittal) delayed planned investments in hydrogen-based projects. 63 Unlike in 2023, few developers of new clean steel and ammonia facilities allocated capital for “co-located” hydrogen plants and renewable energy installations. 64
Despite these setbacks, clean hydrogen projects – encompassing both renewable and low-carbon sources – reached a major milestone, with final investment decisions (FIDs) rising sharply from 102 projects in 2020 (worth around USD 10 billion) to 434 projects in 2024 (worth around USD 75 billion). 65 The share of total hydrogen investment dedicated to clean hydrogen supply projects also increased, from more than 60% in 2020 to 75% in 2024. 66
Global investment in power grids and energy storage reached a record high in 2024. Grid spending rose 15% to USD 390 billion, with growth across all regions, notably in Europe. 67 Investment in energy storage increased 36% to USD 54 billion, driven largely by developments in Asia and the United States. 68 Despite this progress, investment in grid infrastructure still needs to increase significantly to support the expansion of renewable generation required to achieve net zero greenhouse gas emissions targets by 2050. 69
FIGURE 14 Global Investment in Selected Energy Technologies, 2020-2024
i Electrified transport investment is based on preliminary sales data and estimated prices of electric vehicles, fuel cell vehicles, and electric charging infrastructure and hydrogen refuelling stations. Private charging investment for commercial vehicles is not included.
ii Clean industry investments include investments in bioplastics, circular economy, clean ammonia and clean steel.
iv Clean industry projects include, bioplastics, circular economy, clean ammonia and clean steel.

Renewables in Energy Supply
13.4% share of renewables in TFEC in 2022.
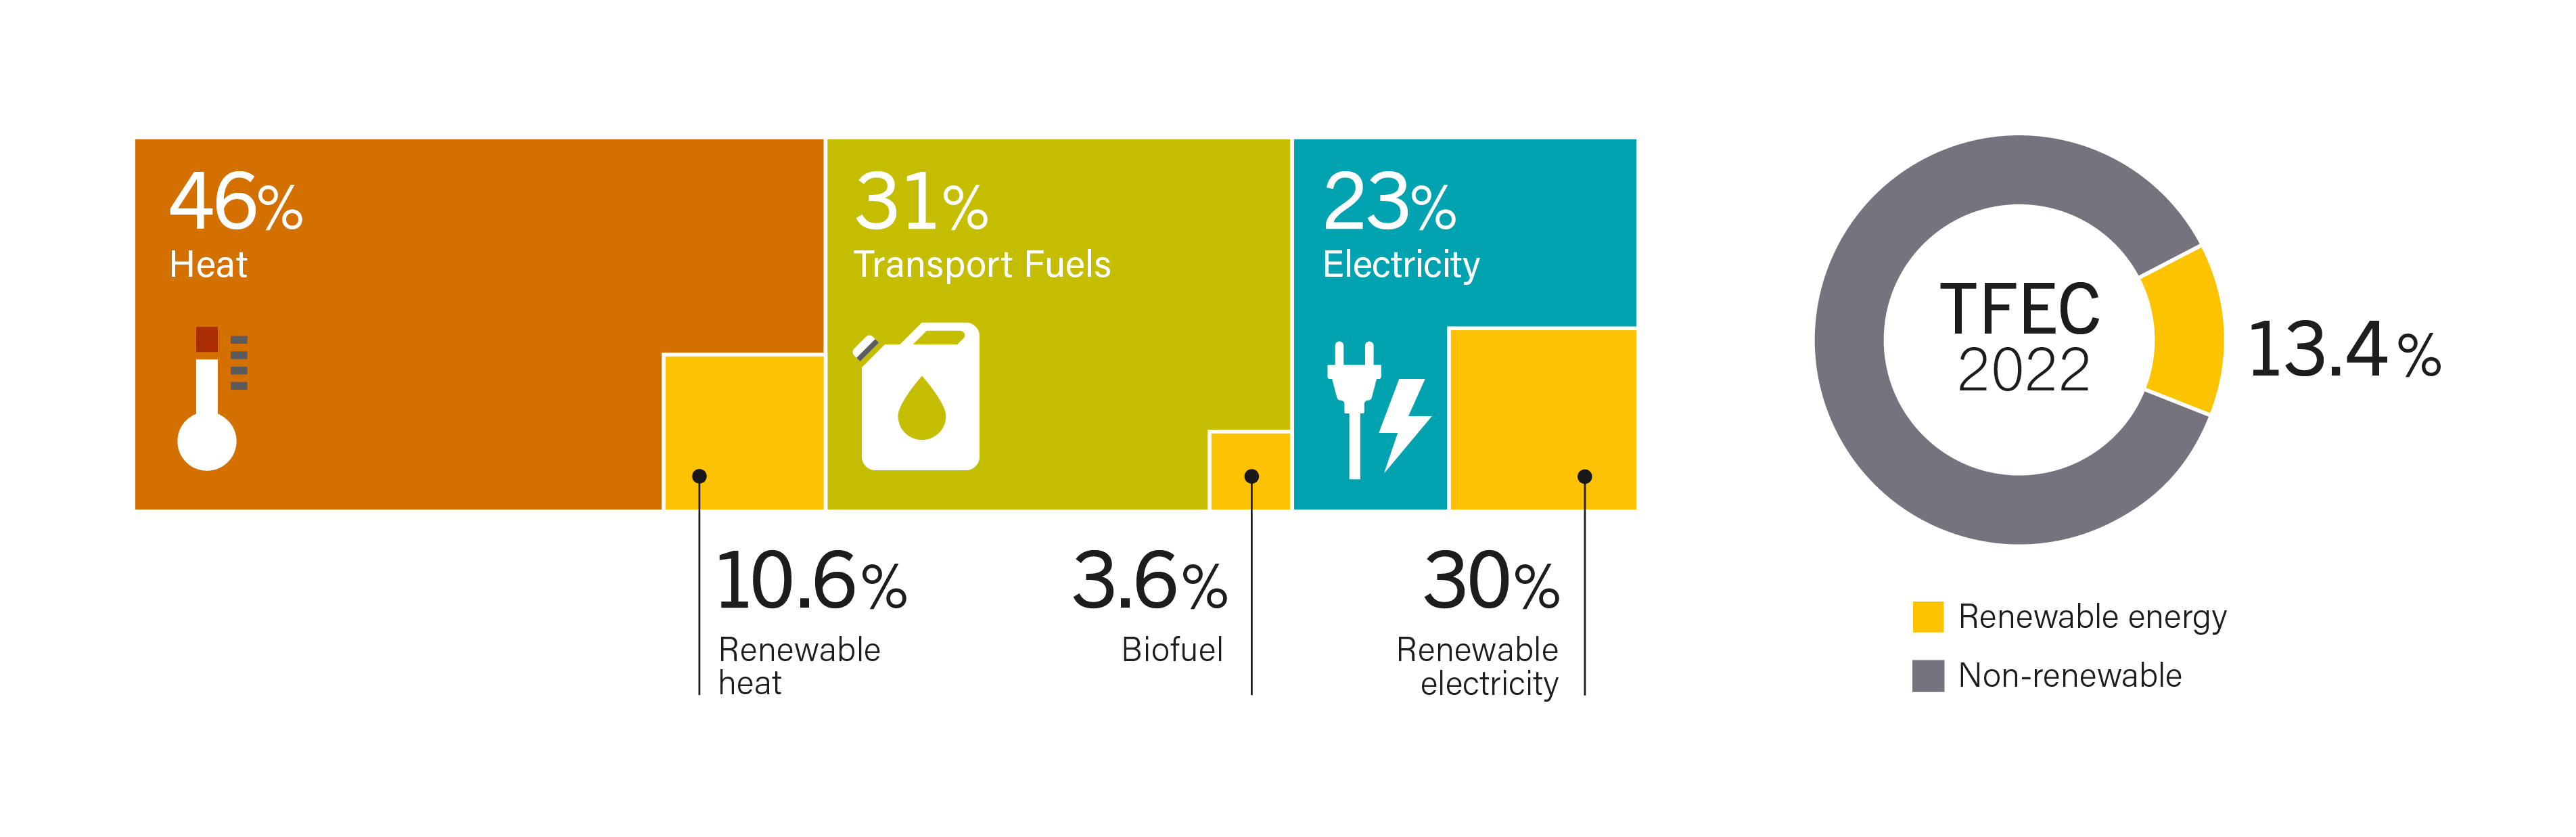
In 2022 (latest data available), modern renewable energy accounted for just 13.4% of global total final energy consumption (TFEC), while fossil fuels continued to dominate across end-use sectors. 1 The breakdown by sector reveals disparities in renewable energy uptake. Although electricity represented only 23% of TFEC, it had the highest share of renewables at around 30% in 2022, up from 23% in 2015, reflecting strong progress in the power sector. 2 (See Figure 15.) In contrast, the heat and transport sectors together accounted for 77% of TFEC (46% and 31% respectively) but lagged in the use of renewable energy. 3 Renewables supplied only 10.6% of the world's heat, and biofuels accounted for just 3.6% of transport fuel use. 4 The world remains a long way from decarbonising heat and transport, which continue to rely heavily on fossil fuels. 5
Renewable Power
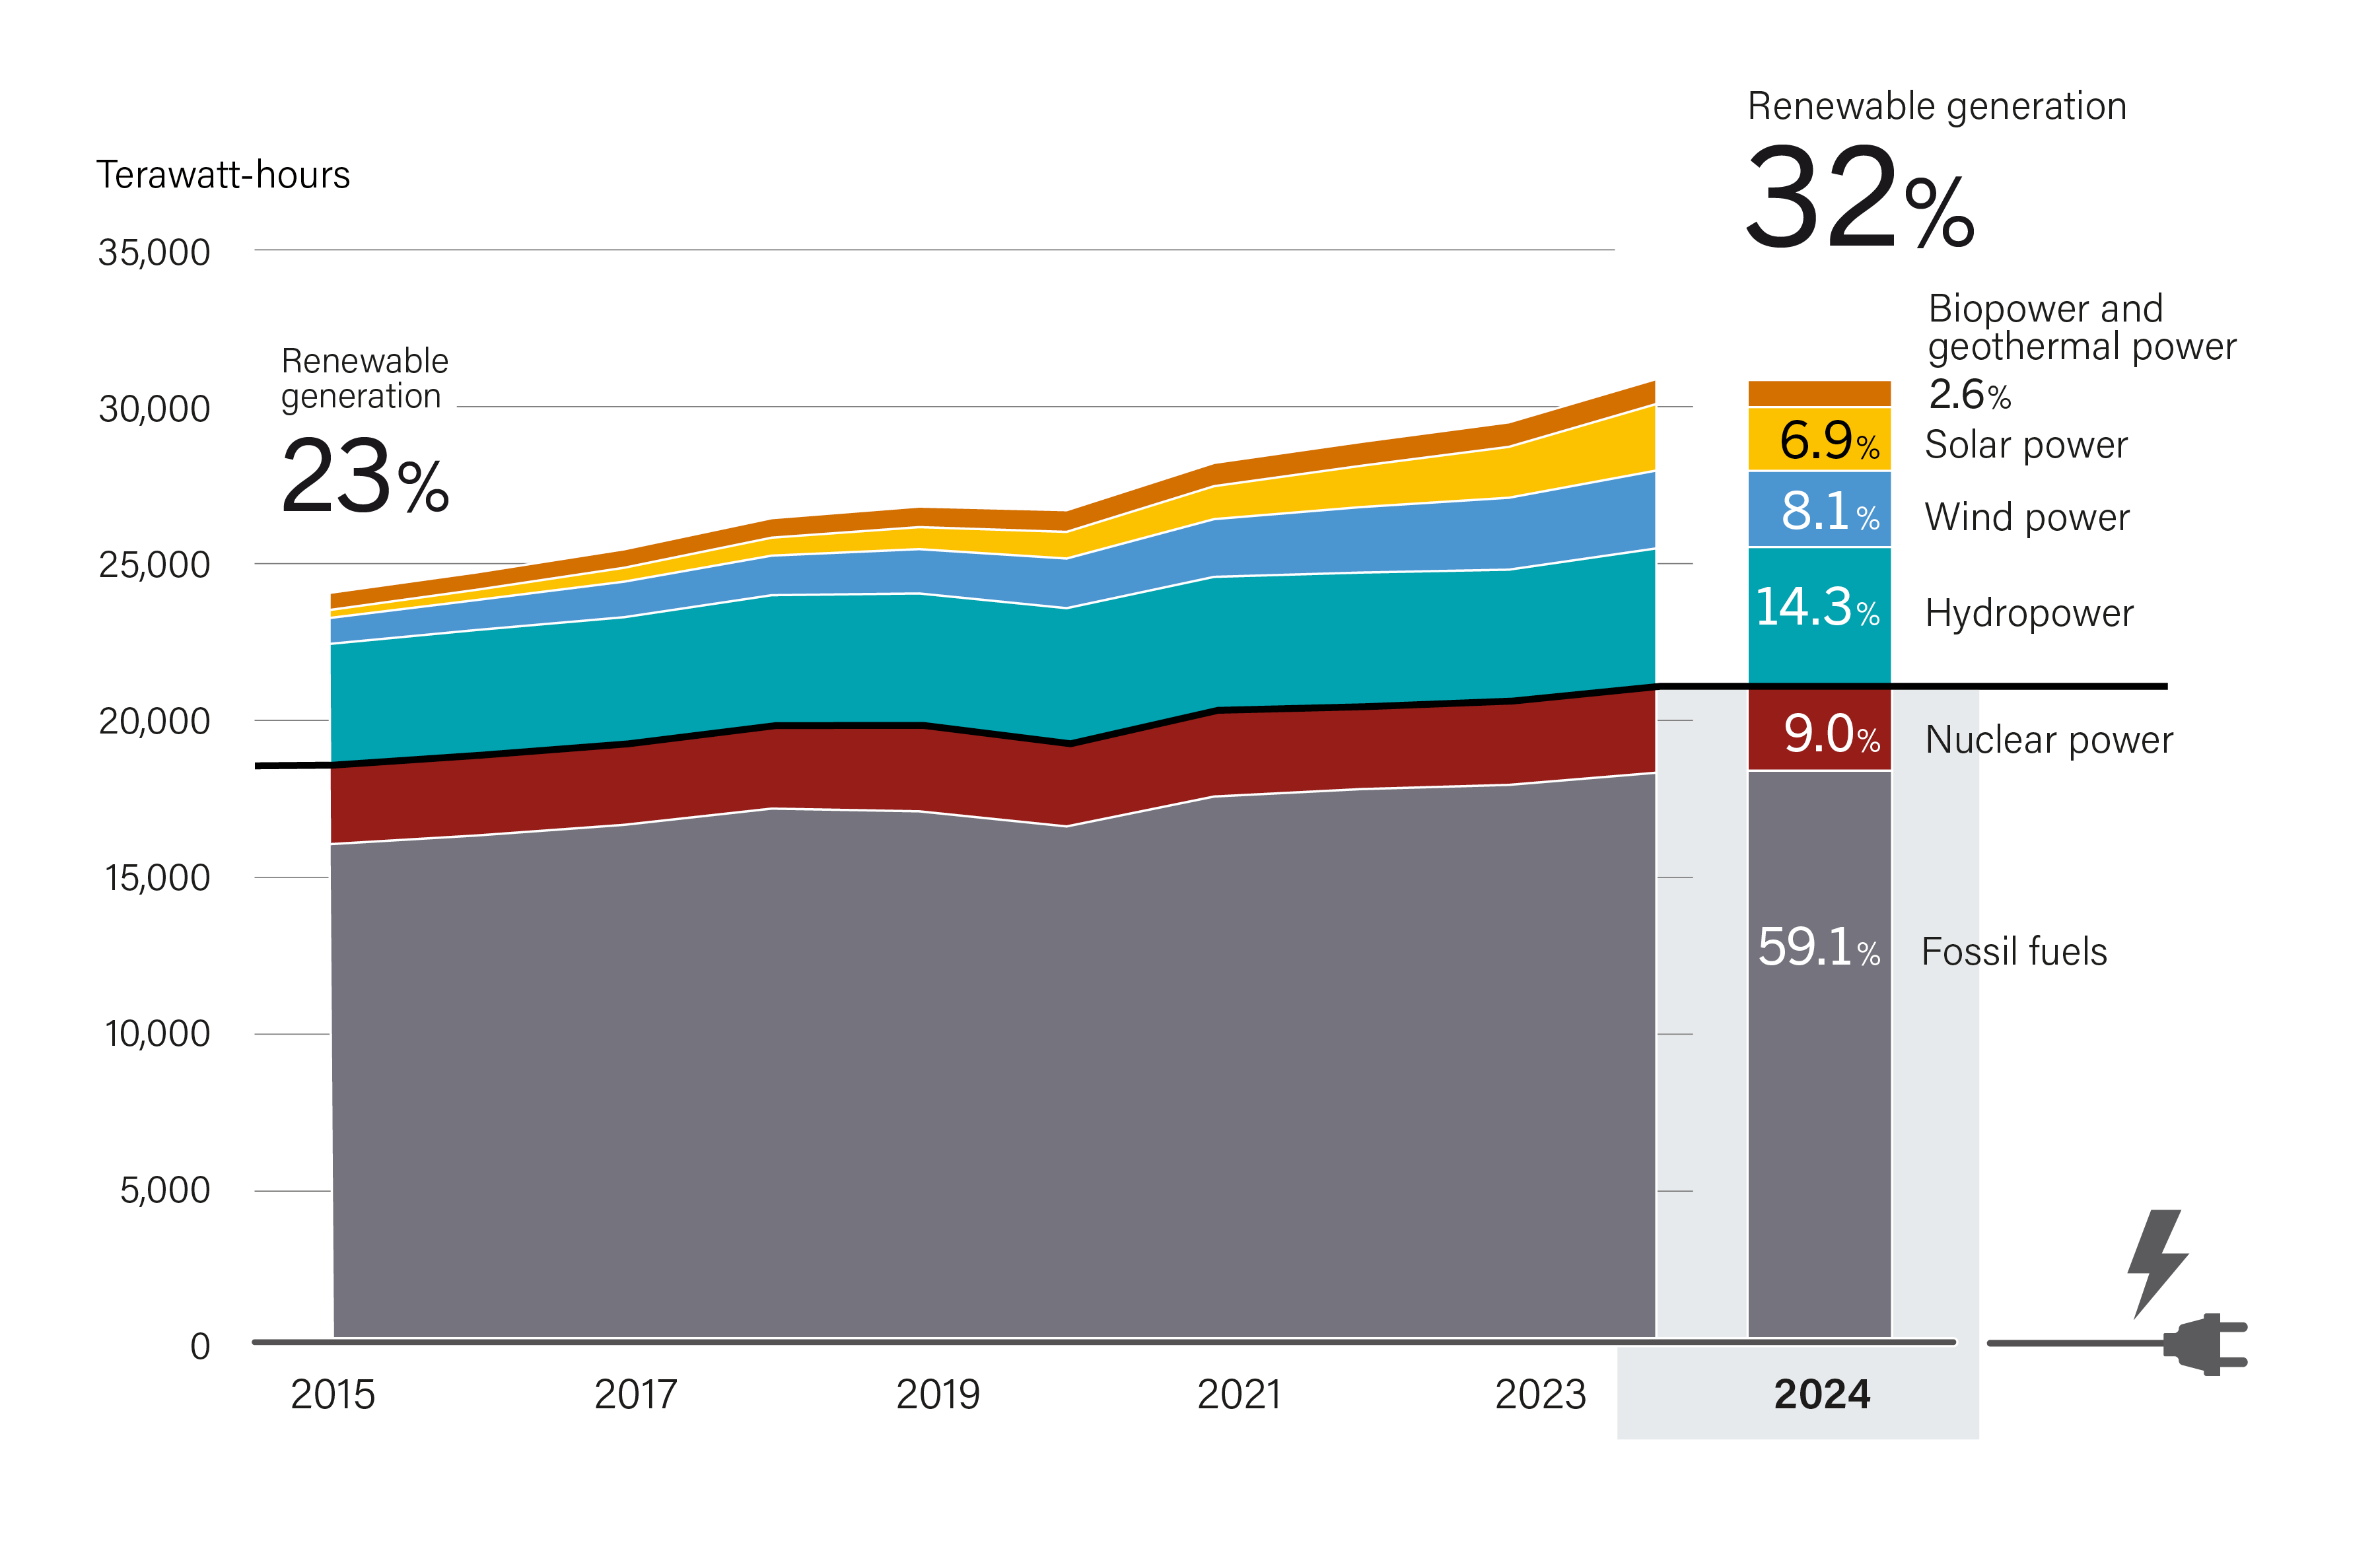
In 2024, global electricity generation reached a record high of around 30.9 thousand terawatt-hours (TWh), with renewables accounting for nearly one-third (31.9%) of the total. 6 (See Figure 16.) Fossil fuels remained the dominant electricity source, generating 18.2 thousand TWh and representing 59.1% of the total, although this share has been declining; nuclear power accounted for the remainder (9%). 7
23% of total final energy consumption is met by electricity.
Hydropower remained the largest source of renewable electricity (14.3% of the total), while wind and solar power saw the most dynamic growth. 8 Between 2015 and 2024, solar power generation increased 16-fold, reaching 2,132 TWh (6.9%), while wind generation rose nearly 4-fold to 2,494 TWh (8.1%). 9 Bioenergy and geothermal power together contributed 800 TWh (2.6%). 10 Thanks to the steady rise in wind and solar generation, renewables are helping to meet rising electricity demand while increasingly displacing fossil fuels in the power sector. 11
FIGURE 15 Total Final Energy Consumption (TFEC) and Share of Modern Renewable Energy, by Energy Carrier, 2022
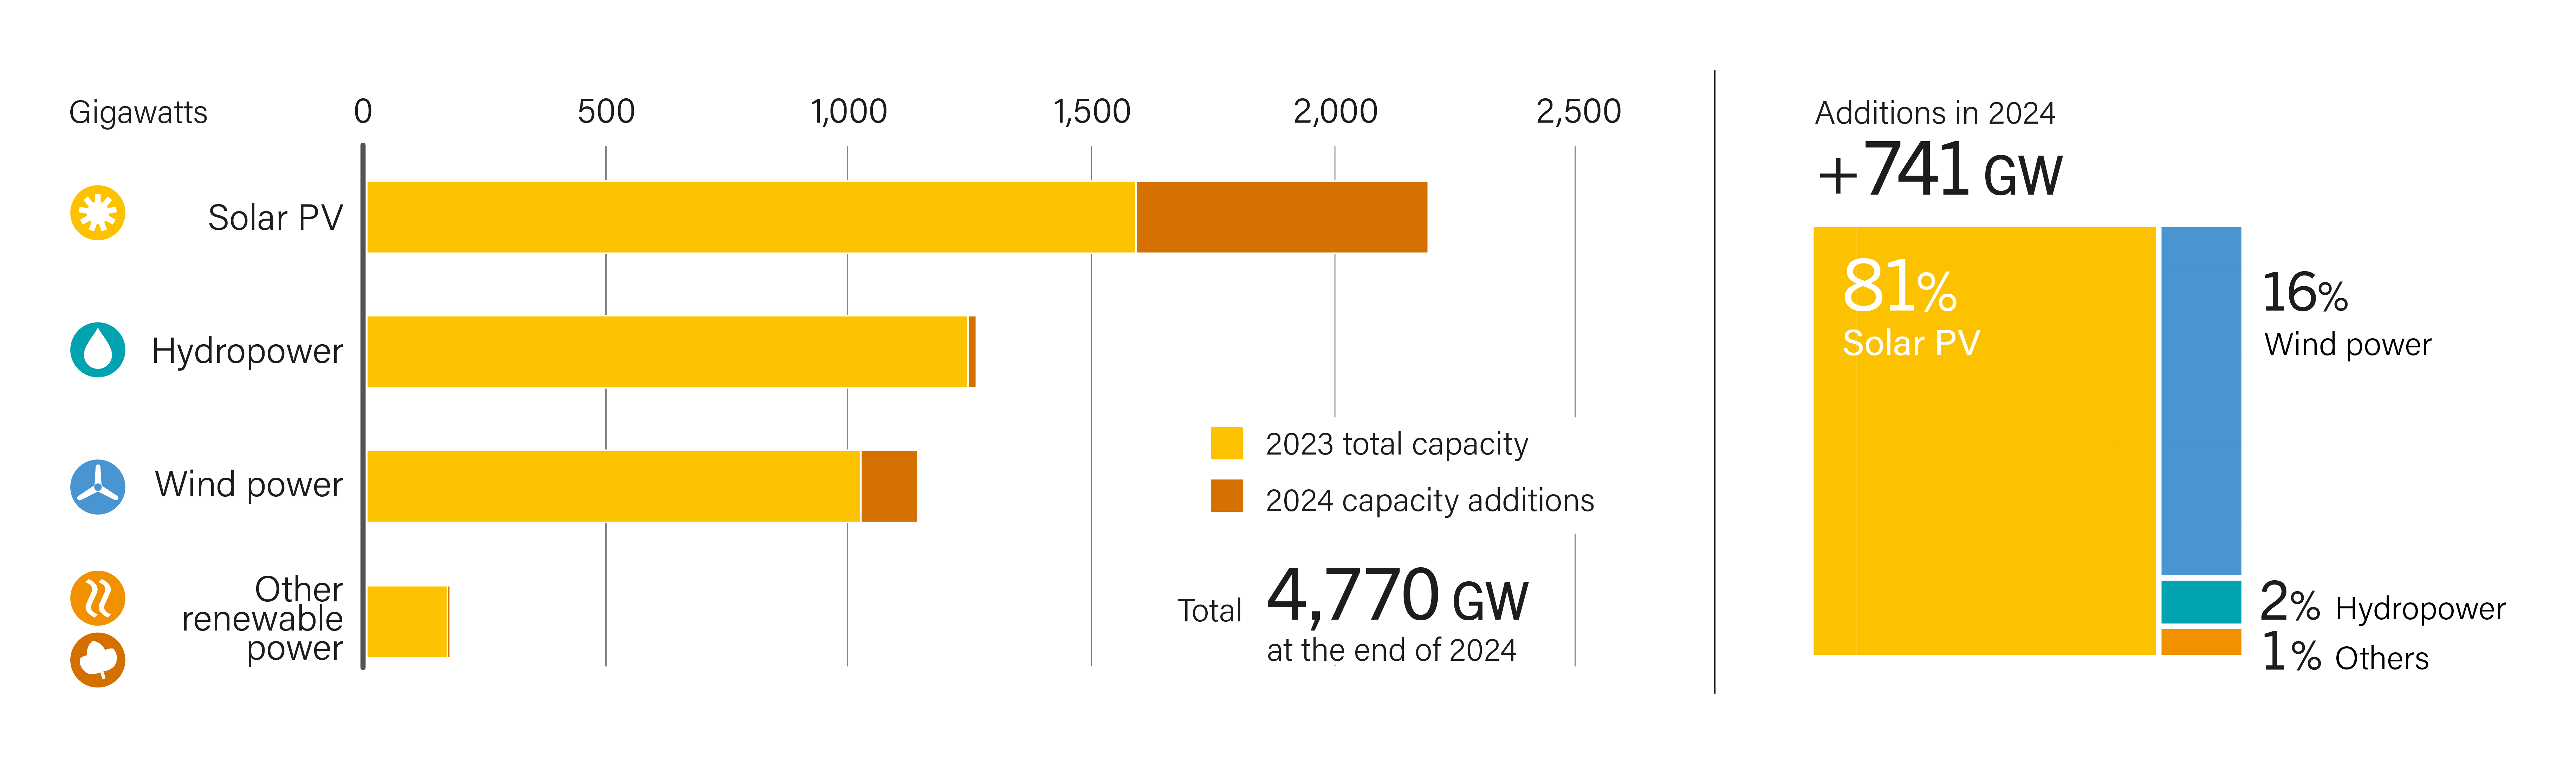
Global renewable power capacity additions totalled 741 gigawatts (GW) in 2024, with China alone accounting for 60.2% (445 GW). 12 (See Figure 17.) Europe contributed 12.4% (92 GW), followed by Asia and Oceania (excluding India and China) with 9.8% (73 GW) and North America with 7.6% (56 GW). 13 India added 36 GW (4.8%) in 2024, while Brazil added 2.4% (18 GW), and the rest of Latin America and the Caribbean added just 1.0% (8 GW). 14 Africa and the Middle East collectively accounted for only 1.7% (13 GW) of renewable power capacity additions. 15 Most growth continued to be concentrated in a few key markets (particularly China), while many regions remain greatly under-represented in the global energy transition.

Solar PV was the clear driver of this growth, accounting for 81% of new capacity additions in 2024, followed by wind power at 16%. 16 (See Figure 18.) Hydropower contributed just 2%, and other renewables – bioenergy, geothermal, concentrated solar thermal power (CSP) and ocean power – accounted for only 1% of newly installed capacity. 17 Solar PV holds a dominant position not only as the most rapidly expanding renewable energy technology, but also as the largest overall source of renewable power capacity.
FIGURE 16 Electricity Generation by Energy Source, 2015-2024
Total cumulative installed solar PV capacity passed the 2 terawatt (TW) mark in 2024, reaching 2.25 TW nearly double the global total in 2022. 18 In 2024 an estimated 602 GW of new capacity was added – up 32% over 2023 –comparable to the cumulative capacity installed globally by 2019. 19 This continued growth was driven by historically important markets such as China (around 60% of the growth), the United States (8%), and India (5%); however, some new entrants were also significant. For example, in Pakistan (3%) solar PV combined with battery systems has become an attractive option for achieving energy autonomy. 20 Pakistan alone installed more solar PV capacity in 2024 than Italy, France and Australia combined. 21

An estimated 116.8 GW i of new wind power capacity was connected to the world's grids in 2024, a record high despite marginal growth (0.2%). 22 Onshore wind installations rose 3.1%, to 109 GW, whereas offshore additions fell 27.5%. 23 China again dominated global wind power additions, accounting for 68.3%; not including China, global additions fell 9.6%. 24 The cumulative wind power capacity in operation grew 11.2% to 1,135.4 GW during 2024. 25 The wind industry had another challenging year, and deployment was slowed by several factors, including political and policy instability, increasing costs and risks, permitting and grid-related challenges, and rising opposition in some key countries. 26 However, installations picked up in some emerging markets, and several countries saw positive policy developments. 27
FIGURE 17 Renewable Power Capacity Additions, by Region/Country
In 2024, hydropower continued to play a central role in renewable electricity generation, with total output reaching an estimated 4,578 TWh. 28 Globally 16.2 GW capacity was added in 2024. 29 China remained the dominant player, adding 6.7 GW of new conventional capacity and maintaining its position as the top hydropower producer, generating more than 1,400 TWh. 30 Other countries that contributed to new capacity additions included Tanzania (added 1.9 GW), Ethiopia (1.2 GW), Bhutan (1.1 GW) and Pakistan (0.9 GW). 31
Capacity in bioenergy, geothermal, ocean power and CSP remained relatively flat, collectively totalling 177 GW. 32 Biopower capacity increased 4.6 GW in 2024, due mainly to new installations in China and France, reaching a global total of 155 GW. 33 Electricity generation from solid biomass power facilities increased globally to 711 TWh, although it fell in Europe with major producers such as Sweden, Finland, Denmark, and the Netherlands seeing reductions, driven by shifts in energy policy, market competitiveness and lower pellet imports. 34
Global geothermal electricity generation reached an estimated 99 TWh in 2024. 35 At least 400 megawatts (MW) of new capacity was added during the year, bringing the total installed capacity to around 15.1 GW. 36 More than half of these additions were in New Zealand, followed by notable developments in the Philippines, Türkiye, Indonesia, the United States and Japan. 37
FIGURE 18 Renewable Power Total Installed Capacity and Additions, by Technology, 2024
+18% annual growth in global renewable capacity in 2024.
Total installed concentrated solar thermal power (CSP) capacity grew by 350 MW to reach 7.2 GW in 2025. 38 The positive dynamics of 2023 continued, with several new projects initiated in China, where the CSP pipeline continued to expand and the first projects of the country's current five-year period were connected to the grid. 39 China's favourable policies for CSP are helping the country to drive the global CSP market. 40
+1,040GW/year needed annually from 2025 to 2030 to meet the global tripling target, nearly 40% higher than the record set in 2024.
For ocean power, the global installed capacity remained relatively unchanged in 2024, with 1.6 MW (net) added. 41 The installed capacity increased by 2.6 MW in the Russian Federation and fell by 1 MW in the Republic of Korea (with downsizing or decommissioning of an existing plant). 42 Policy and investment activity increased compared to previous years. 43
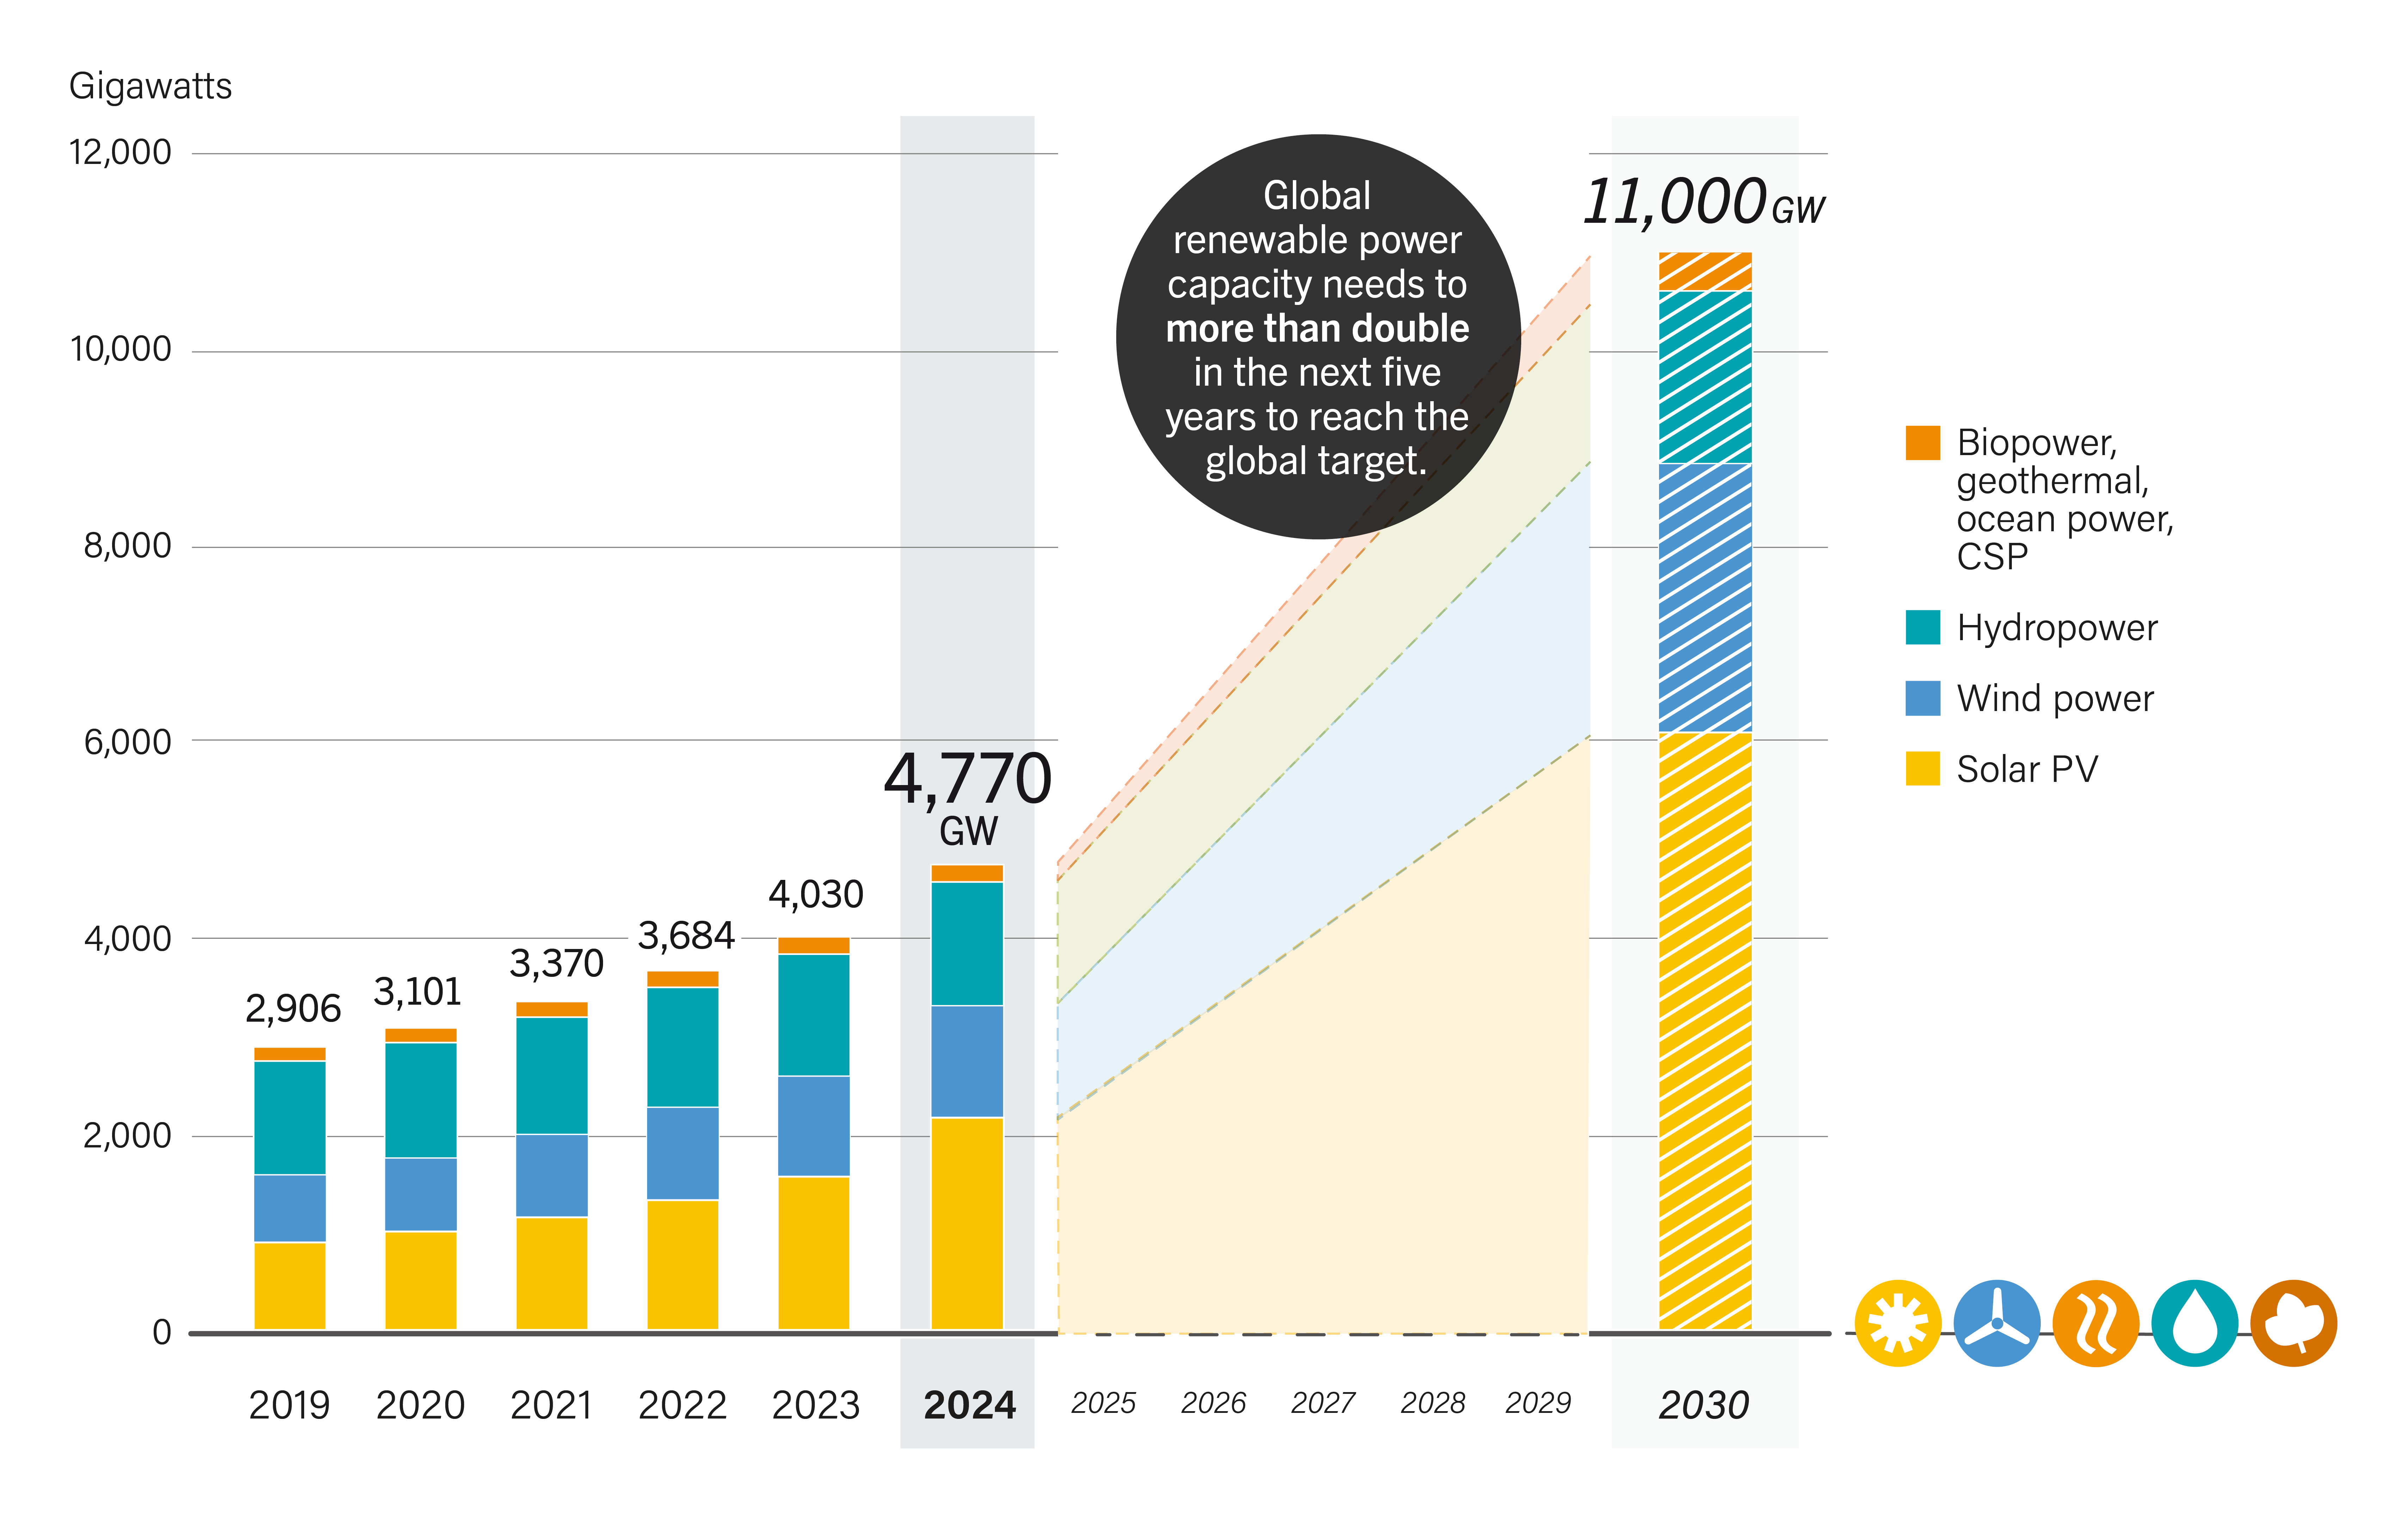
Despite the progress of recent years, at the end of 2024 the world remained far from its collective renewable power capacity target of 11,000 GW by 2030. 44 Meeting this goal will require more than doubling the current installed capacity within just six years, with unprecedented acceleration in deployment. 45 (See Figure 19.)

FIGURE 19 Renewable Power Capacity by Technology, 2019-2024, Compared to 2030 Global Tripling Target
Manufacturing, Labour and Supply Chains
The rapid scale-up in renewable energy deployment has been mirrored by a surge in manufacturing capacity, particularly for solar PV. Global solar manufacturing capacity was expected to exceed 1,100 GW by the end of 2024, nearly double the solar PV demand in 2024. 46 This oversupply has driven module prices down by more than half since early 2023, squeezing profit margins and triggering market instability. 47 In 2024 alone, around 300 GW of polysilicon and 200 GW of wafer manufacturing projects – worth an estimated USD 25 billion – were cancelled. 48 Vulnerabilities in the solar PV supply manufacturing sector have prompted new efforts to strengthen supply chain resilience and diversify sourcing amid growing deployment needs. 49
68% of energy education still focuses on fossil fuels. Only 32% is dedicated to renewables as of 2024.
In the wind sector, uncertainties due to stop-start government policies and unpredictable procurement cycles have created high demand volatility. 50 These factors combined with permitting bottlenecks have led to razor-thin or even negative margins and have rendered investment in the supply chain unviable. 51 In some key regions (Europe, Americas) investment in the supply chain has been insufficient to meet ambitious targets and expected demand beyond the next couple of years. 52 China continued to dominate turbine manufacturing as well as the world's supply chain for critical components and raw materials. 53 Chinese turbine manufacturers represented 6 of the world's top 10 and, for the first time, held the top four spots. 54 While heavily reliant on their home market, China's biggest manufacturers looked to expand sales overseas and opened new factories around the world. 55 Despite record installations and orders, however, intense competition and oversupply of components further reduced profitability for Chinese manufacturers. 56
1,100GW/year global solar PV manufacturing capacity by end-2024. Nearly double current PV demand.
The workforce needed to sustain the energy transition is falling short. 57 Addressing workforce and skills challenges is essential to maintain the momentum of renewable energy growth and to achieve global net zero greenhouse gas emissions by 2050. In 2023, the renewable energy sector employed around 16.2 million people. 58 (See Sidebar 5.)
By 2030, a global shortfall of 7 million skilled workers is projected, particularly in engineering, project management and technical installation roles. 59 The demand for green skillsi is rising much faster than the supply. In 2023, job postings requiring at least one green skill increased 22.4%, while the green talent pool grew by 12.3% across the 48 countries covered in a recent study. 60 This mismatch is compounded by a misalignment in education and training systems. As of 2024, 68% of energy-related degree programmes focused on fossil fuels, with only 32% dedicated to renewables. 61
The fast development of the renewable energy manufacturing industry is increasingly attracting attention to the working conditions along supply chains. Governments, industry players and civil society organisations are looking into safeguards to ensure that the industry develops with respect for worker's rights. Focus is also given to solutions for avoiding or mitigating potential environmental impacts of renewables deployment. 62 (See Sidebar 6.)
Sidebar 5. Renewable Energy Employment: Data and Trends
In 2023, global employment in the renewable energy sector reached a record 16.2 million jobs, up from 13.7 million in 2022 i . (See Figure 20.) The majority of job growth in renewables was in the solar PV sector, which increased by 2.2 million jobs in 2023 to reach 7.1 million, or 44% of the global total. The second largest share of renewable energy jobs was in the bioenergy sector, which employed 3.9 million people, or 24% of the total. Hydropower accounted for 14% (2.3 million people), while wind energy represented 9% (1.5 million people).
FIGURE 20 Global Renewable Energy Employment, by Technology, 2017-2023
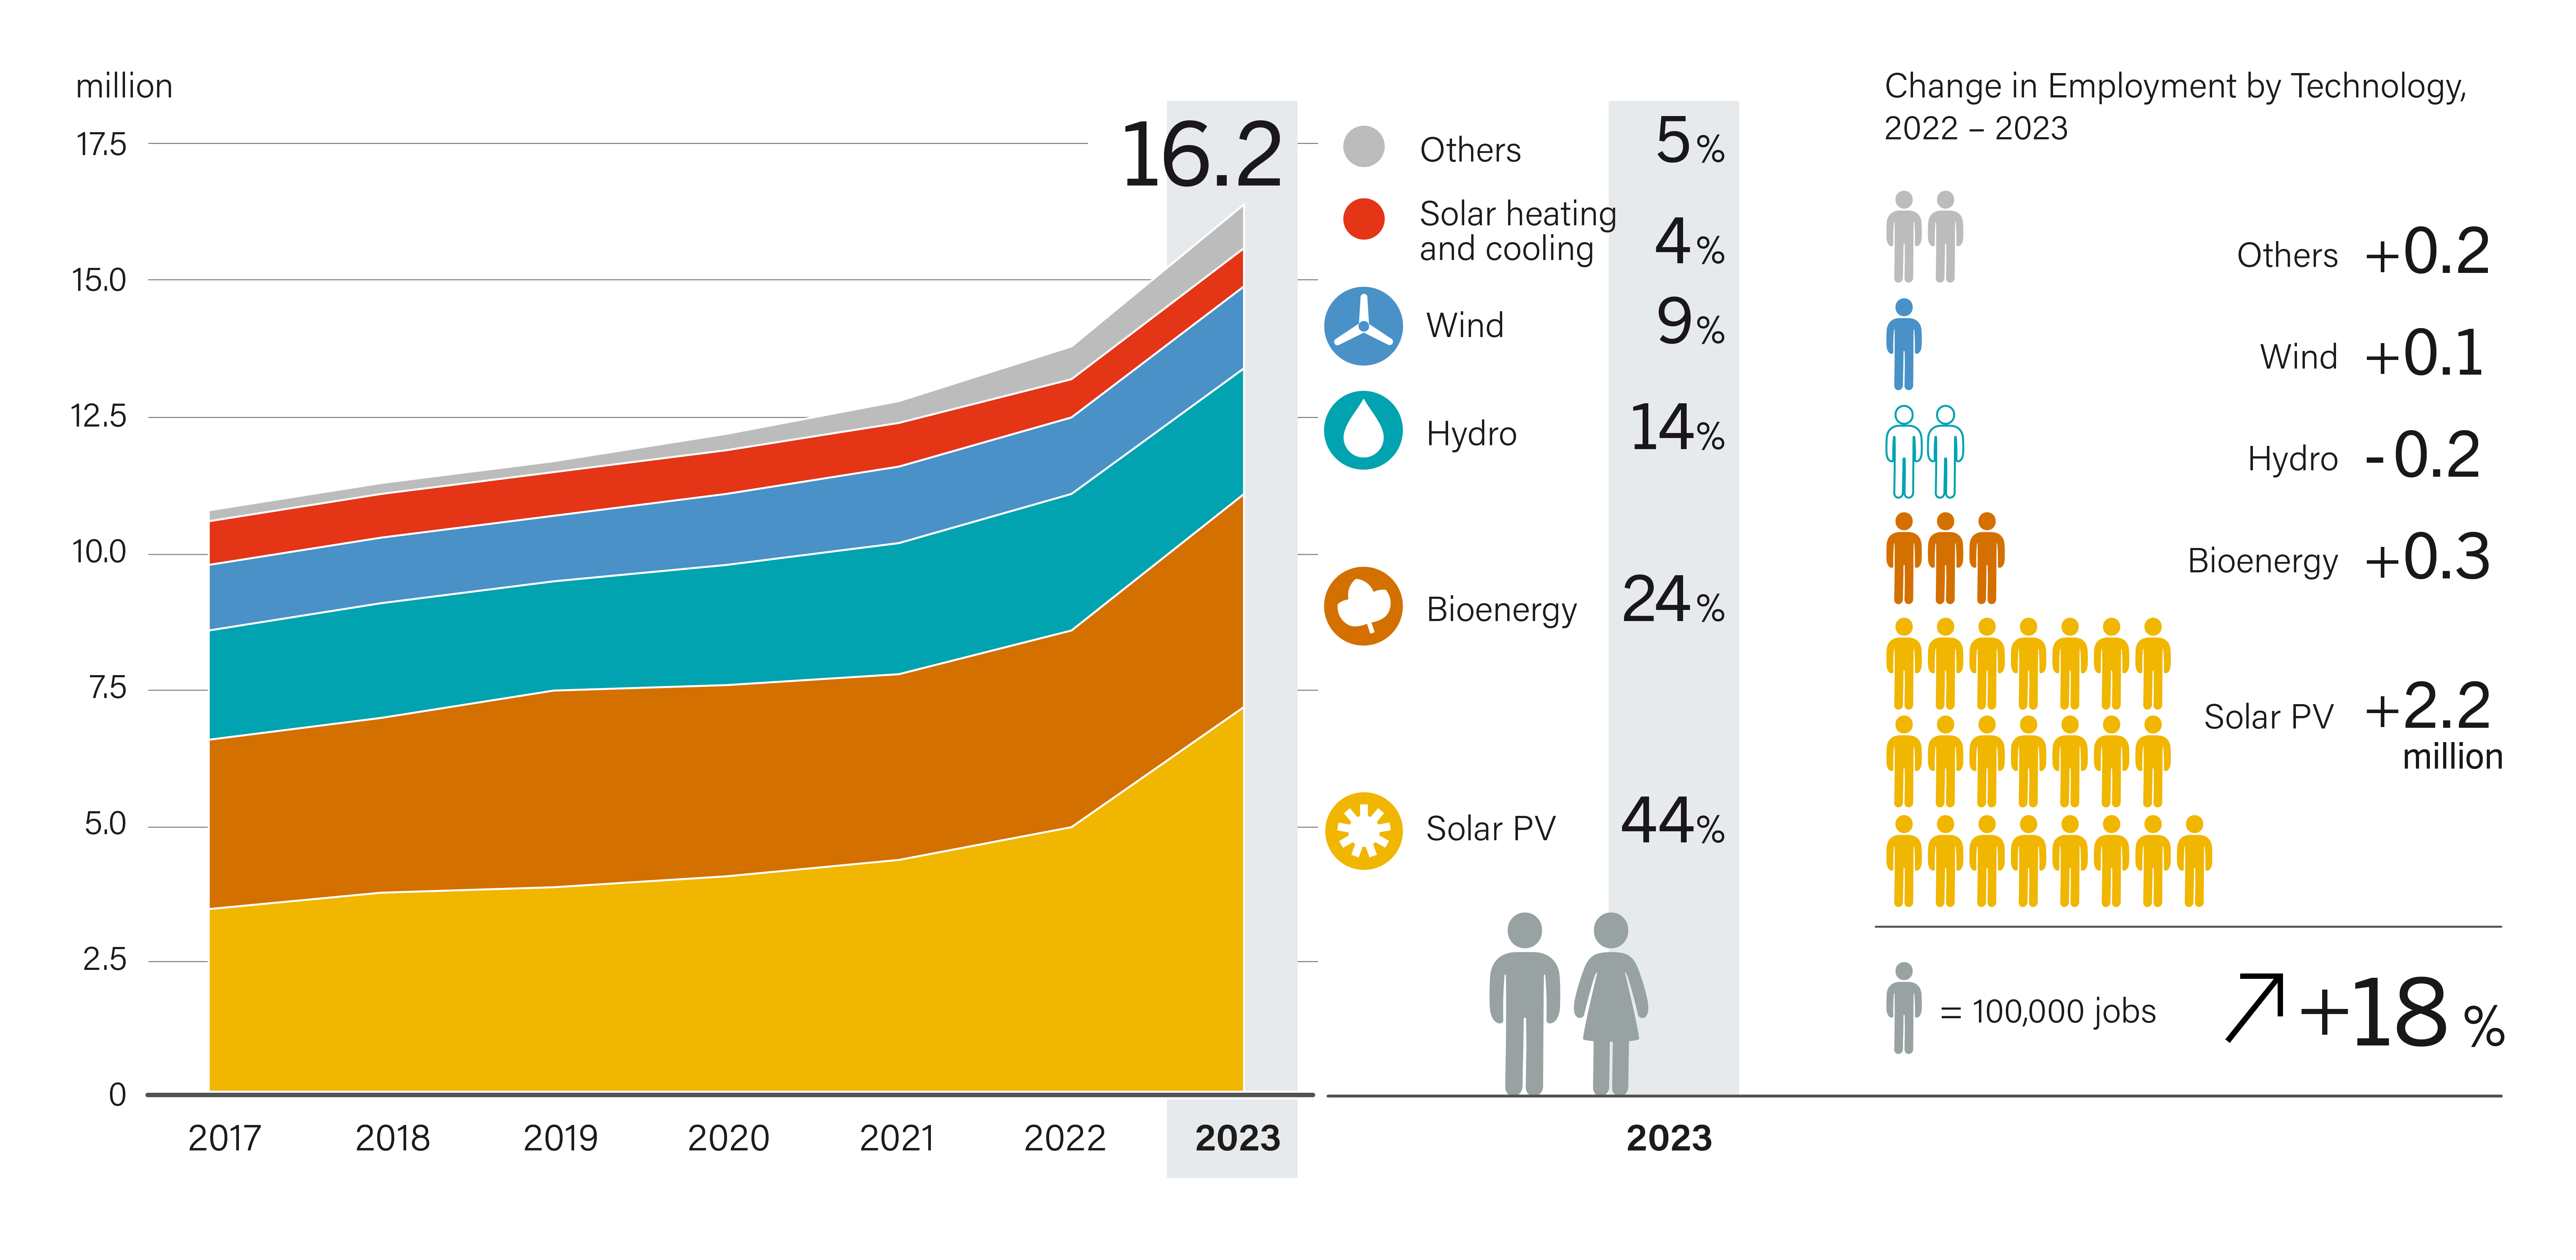
Trends in renewable energy jobs vary widely across regions, shaped by policy frameworks, investment levels and the availability of skilled labour. Asia continued to account for the largest share of global renewable energy employment in 2023, with China alone hosting 7.4 million jobs, around 45% of the global total. This is due largely to China's integrated renewable energy supply chain, supported by infrastructure investment, comprehensive industrial strategies for manufacturing and deployment, and relatively low material, capital and labour costs compared to other global players. More than 60% of China's renewable energy jobs were in solar PV in 2023. The rest of Asia accounted for around 2.2 million jobs in the renewables sector that year.
The EU's renewable energy workforce reached 1.8 million in 2023, concentrated mainly in solar PV (around 40%), followed by biomass and wind energy. To strengthen skills and boost employment in renewables, the EU introduced new policies and initiatives in 2024, including the Renewable Energy Skills Partnership. This initiative aims to equip workers with the skills needed for manufacturing and managing renewable energy technologies, with a goal of creating more than 3.5 million jobs by 2030 in support of EU energy and climate targets. In early 2025, the EU-funded initiative RESkill4NetZero was launched, aiming to accelerate workforce reskilling from other sectors and to address the rising demand for renewable energy jobs across Member States.
Brazil had around 1.6 million renewable energy jobs in 2023, despite being a net importer of renewable energy products and services. The biofuels sector, supported by the government's relatively high biofuel blending mandates, comprised the bulk of these jobs (63%), followed by solar PV (17%) and hydropower (11%). In 2024, Brazil reinforced its commitment to growing the bioenergy workforce through policies such as the Fuel of the Future Law and the National Biogas Roadmap, emphasising skills development to support the sector's expansion.
India and the United States each had around 1 million jobs in renewables in 2023. Meanwhile, across the entire African continent, renewable energy employment was just 324,000, despite its significant potential. This reflects the region's small share of global investment in renewables. To realise Africa's potential and boost renewable energy jobs, it is crucial to enhance skills development as well as workforce training and to strengthen regional supply chains across both the supply and demand sectors.

Across many developing countries, the anticipated rise in employment from the energy transition has yet to materialise, mainly because of slower renewable energy deployment and skill shortages. Despite hosting around 60% of the global labour force, developing countries held only 7% of global manufacturing jobs in renewables and enabling technologies in 2023 iv . Meanwhile, developing countries accounted for 80% of job growth in the upstream supply of raw materials for renewables and enabling technology sectors since 2019, including materials such as minerals and bioenergy feedstocks.
Globally, despite substantial growth in renewable energy employment in some countries and regions, direct and indirect renewable energy jobs accounted for only 0.4% of the total labour force of 3.65 billion in 2023, while direct and indirect jobs in all energy sectors made up around 1.8%.
Expanding the renewable energy workforce globally, especially in developing countries, requires education and skills development that is inclusive of gender, social equity and the reskilling of workers from the fossil fuel sector. As of May 2025, 22 countries had submitted their latest round of Nationally Determined Contributions (NDCs) towards reducing greenhouse gas emissions under the Paris Agreement, but fewer than 10 of these countries referred to skilling or vocational training in the renewable energy sector to support their climate goals. They included Andorra, Brazil, Canada, Kenya, the United Arab Emirates, the United Kingdom and Uruguay.
Although renewable energy employment is expanding, much of the growth remains regionally concentrated. Realising the full potential of jobs in renewables will require coherent policies and enabling institutional frameworks, investment, education, skilling and reskilling across regions and communities.
i The renewable energy employment data in this sidebar are sourced from IRENA and cover direct and indirect jobs. Direct employment refers to jobs created by core activities, excluding those involved in the production of intermediate inputs used to manufacture renewable energy equipment or to construct and operate facilities. Indirect employment includes jobs in upstream industries that support and supply these core activities. This may include workers involved in producing materials such as steel or plastics, or in providing financial and other related services.
ii Manufacturing jobs in renewable energy and enabling technologies include manufacturing jobs across electric vehicles, batteries, heat pumps, solar PV and wind energy.
Sidebar 6. Renewable Energy and Sustainability: 2024 in focus
With the fast pace needed for renewable energy deployment, concerns have emerged about the potential social and environmental impacts. Many of these concerns may be driven by misinformation, yet others can stem from real challenges that can arise from scaling up any infrastructure. There is growing understanding of how to anticipate, avoid or mitigate the potential impacts of renewables development through effective regulation, stakeholder engagement and best practices.
Key focus areas include land use change, biodiversity protection, respect for human rights (including Indigenous Peoples and workers' rights), and the impacts of rising demand for minerals deemed critical for renewable energy and electrification, such as copper and lithium. In 2024, a variety of relevant guidance documents were released and initiatives undertaken, including:
• A multi-stakeholder panel appointed by the UN Secretary-General released the “Guiding Principles on Critical Energy Transition Minerals”, focused on human rights, environmental preservation, and fair benefit sharing in minerals extraction and processing.
• The Nature Conservancy published the report Enabling a Community-Powered Energy Transition, showcasing good practices in stakeholder engagement to generate tangible benefits for host communities.
• The Renewables Grid Initiative, with the Institute for European Energy and Climate Policy, launched Engage4Energy, a toolkit to help developers and authorities facilitate stakeholder participation.
• Climate Action Network Europe, in collaboration with Eclareon, developed a 10-step permitting checklist aimed at accelerating renewables deployment while protecting nature and promoting public engagement.
• The Indigenous Peoples Global Coordinating Committee issued principles for a just energy transition, centred on Indigenous rights; Free, Prior and Informed Consent (FPIC) and Indigenous-led renewable initiatives.
• The Business & Human Rights Resource Centre and Indigenous Peoples' Rights International published recommendations to foster fair benefit sharing, Indigenous co-ownership and leadership in renewable energy projects.
• The International Union for the Conservation of Nature and Natural Resources (IUCN) published an overview of approaches for enhancing biodiversity while developing solar and wind projects.
• SolarPower Europe and The Nature Conservancy jointly called for EU policy makers to incentivise “nature-inclusive” solar parks that deliver biodiversity gains, backed by monitoring frameworks and regulatory incentives.
Several governments also introduced new measures in relevant areas in 2024.
Human rights and Indigenous Peoples rights: Brazil advanced legal recognition of Indigenous Peoples' territories, adding three more territories to the ones previously recognised, while Peru's national biodiversity strategy acknowledges the key role of Indigenous Peoples in biodiversity conservation. Mexico's electricity law defines the concept of energy justice and enacts the state's obligation to promote it, including respect for human rights and the rights of Indigenous and Afro-Mexican people. In the EU, the Corporate Sustainability Due Diligence Directive of 2024 mandates human rights and environmental due diligence for large companies above 1,000 employees and USD 487 million (EUR 450 million) turnover. However, civil society organisations have criticised EU efforts to simplify social and environmental regulations under the “omnibus” directive.
Land use change: South Africa requires agro-ecosystem assessments for renewable energy projects on farmland under the Protection and Development of Agriculture Land Act. Viet Nam's 2024 electricity law and land law respectively aim to streamline permitting for renewable projects and introduce mechanisms to prevent speculative land use. France and Germany introduced legal definitions for agrivoltaics, setting limits on land conversion and yield reduction per project. Canada's Clean Fuel Regulation defines feedstock criteria based on land use and biodiversity conservation.
Citizen participation: Japan's Renewable Energy Act, Mexico's electricity law and Spain's offshore wind regulations all mandate consultations with potentially affected communities prior to the submission of energy project permits. South Africa's Climate Change Act outlines principles of a “just transition”, including public transparency and decent work standards.
Industry certification: The Hydropower Sustainability Alliance awarded four new certifications in 2024 under its sustainability standard, to projects in Brazil, New Zealand, the Philippines and Zambia. The Solar Stewardship Initiative issued the first site certification under the environmental, social and governance (ESG) standard and launched the supply chain traceability standard.
Source: See endnote 62.
Renewable Heat and Fuels
In 2022 (latest data available), the share of modern v renewable energy in total heat production reached 12.3%. 63 (See Figure 21.) The share of traditional biomass in total heat supply fell to 10%. 64 Meanwhile, fossil fuels remained dominant, maintaining a stable and high share of around 77%. 65
3.2% growth in total renewable heat supply in 2022.
Total renewable heat supply increased 3.2% in 2022. 66 Modern bioenergy provided 8.3% of global heat in 2024, with solid bioenergy playing a major role in supplying district heat networks. 67 The EU led the pellet market, accounting for 44% of production and 50% of consumption in 2023 – mainly for residential use; after years of growth, production stagnated in 2023 because of higher input prices, falling industrial demand and a record warm winter. 68 Renewable electricity for heat grew steadily, highlighting the growing role of electrification in the heat sector. 69 However, direct renewable heating technologies continue to provide only a modest contribution to global heat supply, due in part to limited policy support. 70
FIGURE 21 Share of Renewable Heat Production, by Energy Source, 2012 and 2022
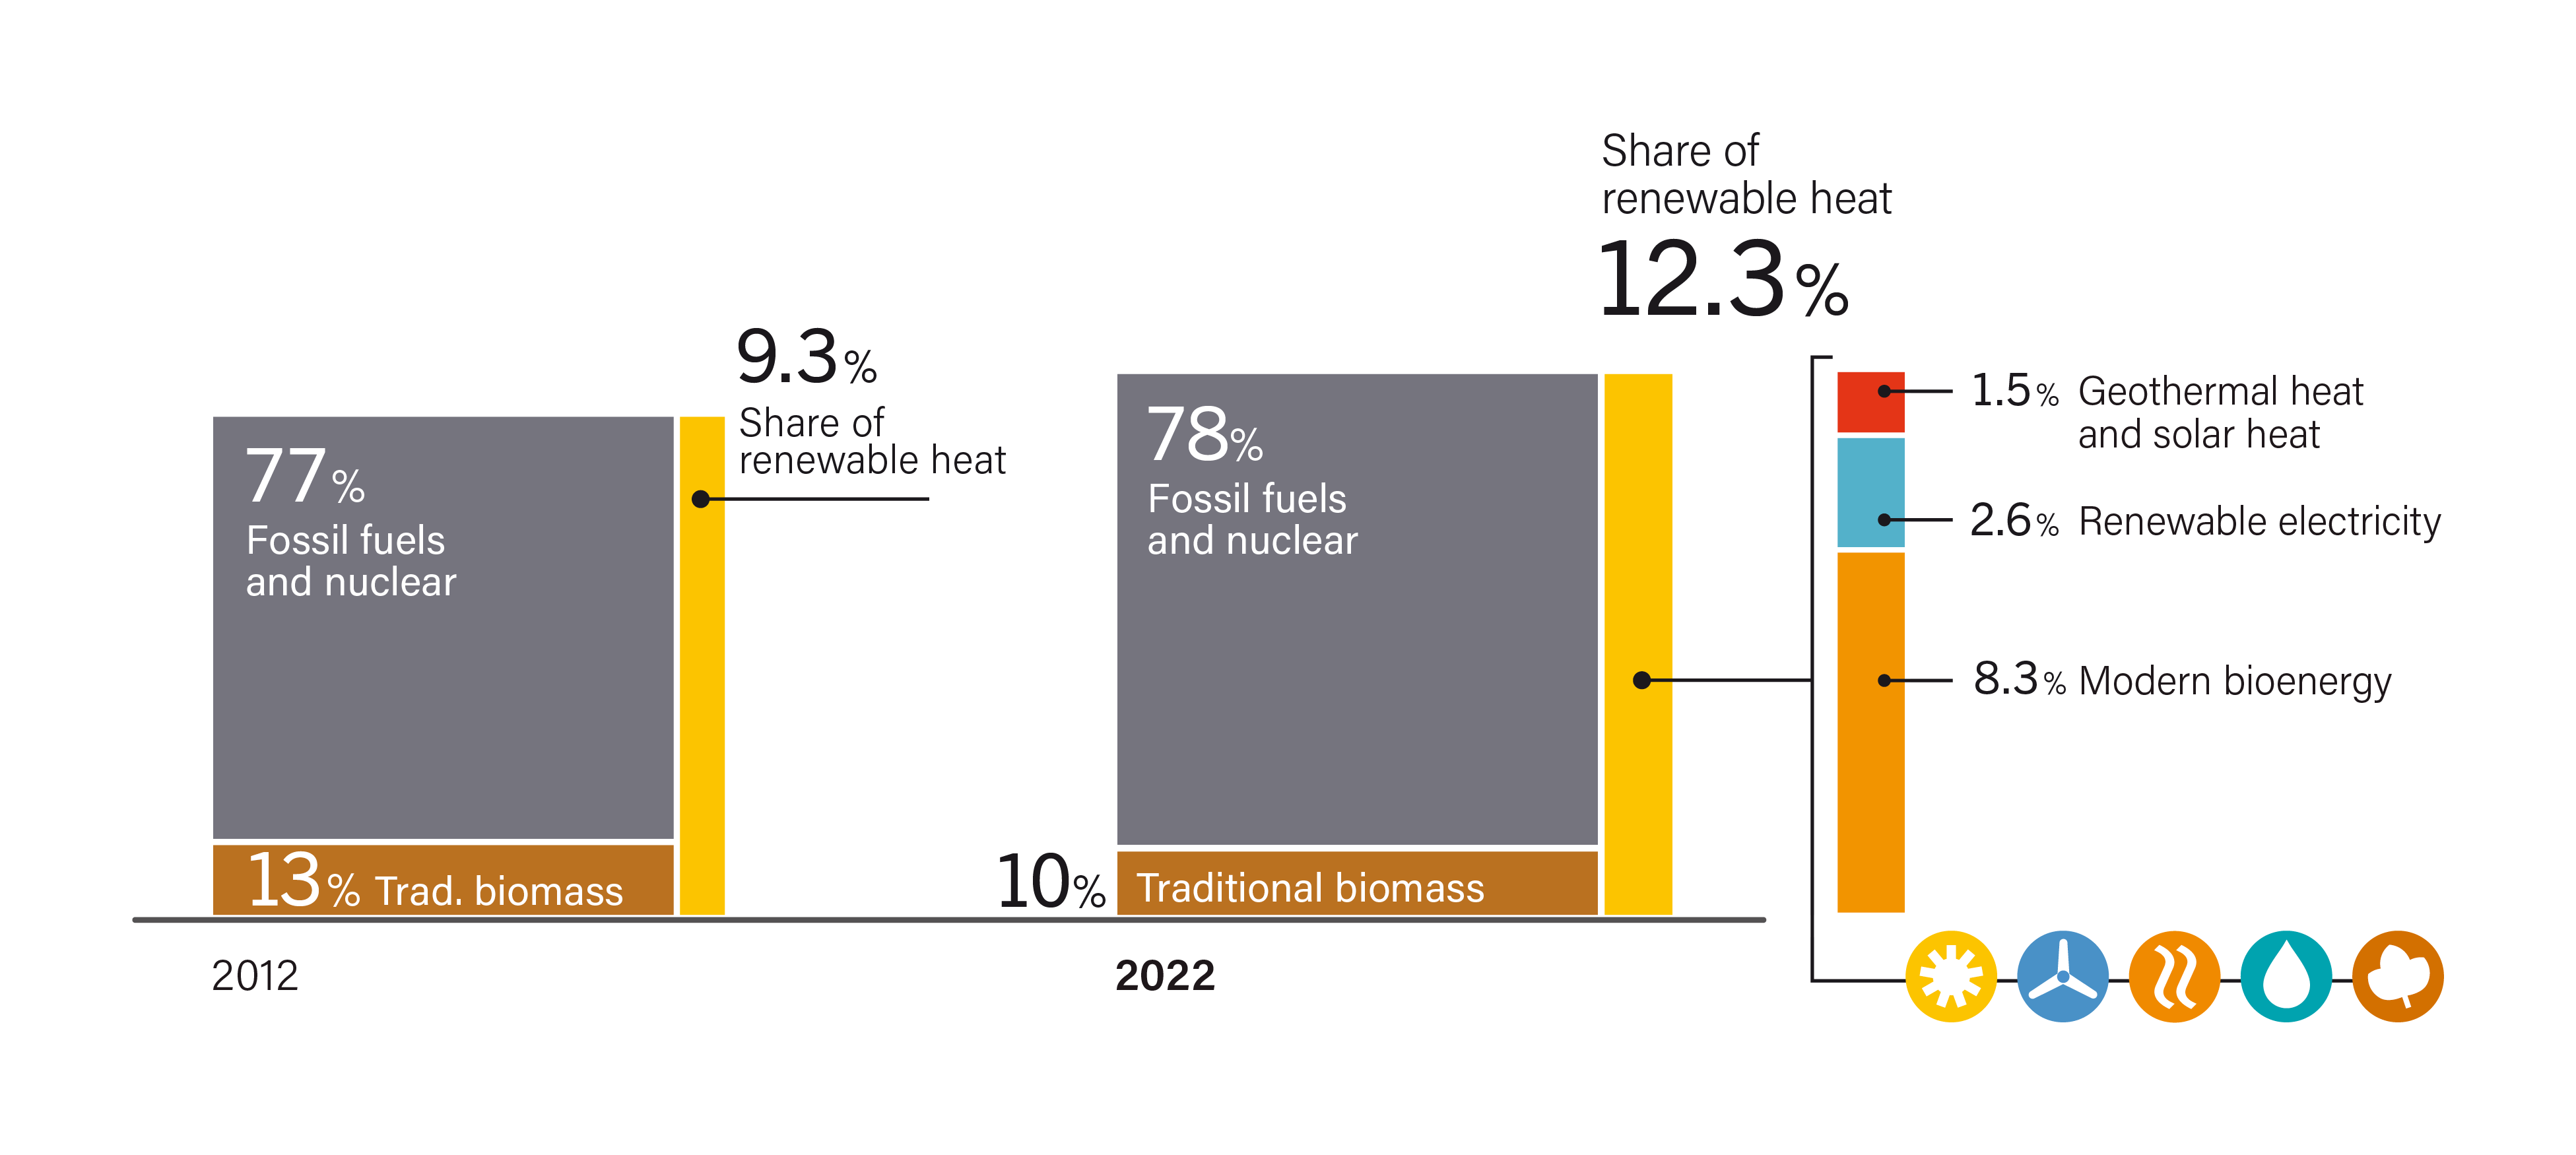
Geothermal heat, which does not include ground-source heat pumps, supplied around 245 TWh (882 petajoules), with China alone accounting for an estimated two-thirds of global geothermal heat output. 71 Due to China's rapid expansion in this sector, the country now produces 43% more geothermal heat than the entire world did in 2019. 72 Among other leading countries, geothermal continued to grow in Türkiye; Iceland saw only modest increases, and Japan experienced a decline. 73

Geothermal Power Plant in Iceland
By the end of 2024, solar thermal heating systems were supplying direct heat to millions of residential, commercial and industrial clients in at least 134 countries. 74 The global market for solar thermal water collectors contracted 14.2% in 2024, due mainly to an ongoing decline in China, the largest market. 75 However, during the year, China also commissioned the world's largest solar thermal plant, demonstrating continued investment in large-scale applications despite the overall market decline. 76 (See Snapshot China) Small-scale systems continued to lose market share in several regions, whereas demand grew for large-scale solar collectors (water, air and concentrating systems) – including for district heating systems and industrial process heat – as cities and companies sought to decarbonise their operations. 77 Solar thermal heating technologies continued to face multiple challenges, including market competition due to a lack of awareness and an imbalance in incentives. 78

Toftlund District Heating Solar Park, Denmark
Liquid biofuel production rose 7% in 2023, reaching a total of 175.2 billion litres, led by Brazil, India, Indonesia, and the United States. 79 (See Figure 22.) In 2024, following a full year of B35 implementation – the world's highest national mandate for blending biodiesel in petrol – Indonesia reported palm oil-based biodiesel production of 13 billion litres and consumption of 12.6 billion litres. 80 Ethanol and renewable diesel production hit record highs in the United States, while the EU remained the largest bio-based diesel market despite a decline in Swedish blend mandates. 81 In 2024, Brazil enacted the Fuel of the Future law, setting blending levels for biomethane, higher blending mandates for ethanol (from 22% to 27%, with a potential to reach 35%) and biodiesel (increasing one percentage point annually, starting 2025, to reach 20% by march 2030), and also setting greenhouse gas reduction targets for the aviation sector and a national programme for green diesel. 82 Sustainable aviation fuel (SAF) production grew but still covered less than 1% of aviation fuel demand; in 2024, new SAF mandates in India, Indonesia and the Republic of Korea are expected to drive future growth. 83
FIGURE 22 Global Supply of Ethanol, Biodiesel and Renewable Diesel, 2014-2023
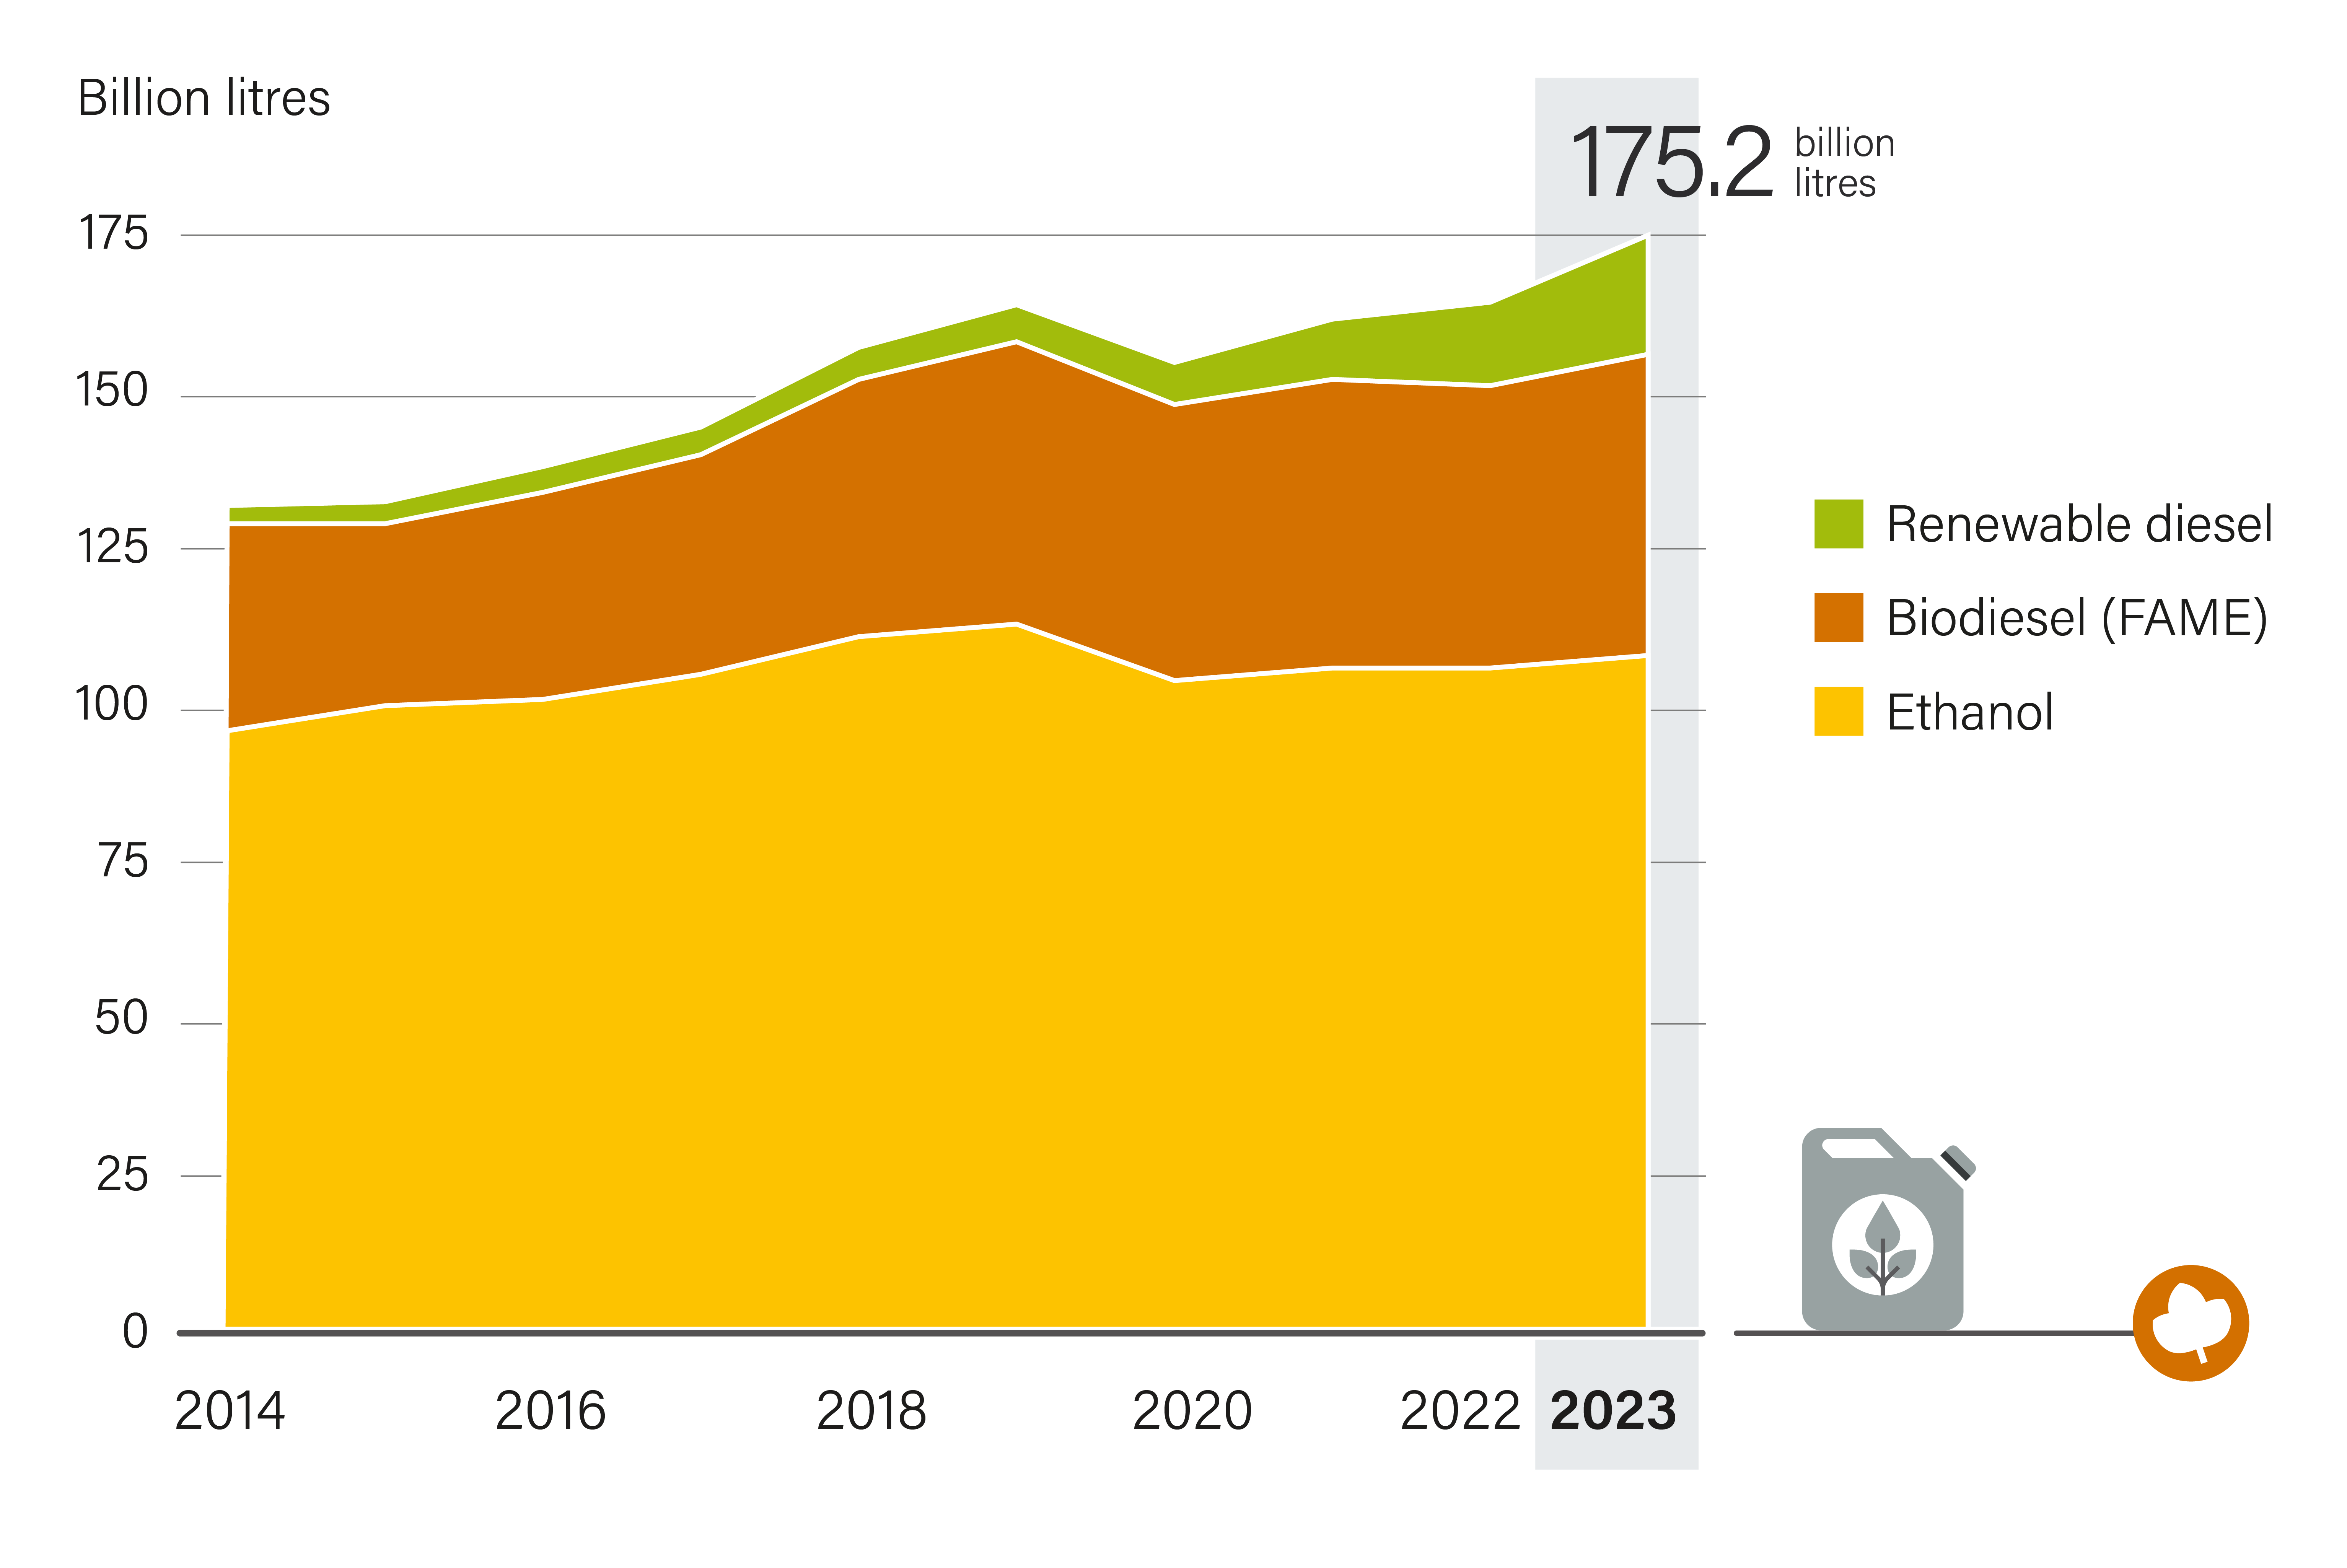


Snapshot CHINA
World's Largest Concentrated Solar Thermal System
Kunlewan International Tourism Resort, which opened in May 2024, is located in Handan city in the northern Chinese province of Hebei. It hosts the world's largest concentrated solar thermal system, with a total of 4,159 solar collectors installed across the 114,000 square metre solar mirror field i . Adjusted by a sun-tracking system, the mirrors focus sunlight onto receiver tubes, heating oil that stores thermal energy at 150-180°C. The heated oil is then piped to the energy conversion system, which supplies heating and cooling for the leisure resort through plate heat exchangers, ammonia absorption chillers and lithium bromide absorption chillers.
Energy generated from the solar system is stored in two types of units: heat storage tanks and cold storage tanks. For system control and management, the energy data control centre connects all equipment across the resort with a tracking system and a distributed control system (DCS) for industrial automation. This enables continuous 24-hour operation, even when unattended. A dedicated system adjusts the project's energy distribution based on varying weather conditions. The space beneath the solar collectors is used as a car park with more than 3,000 parking spaces and over 400 electric vehicle charging stations.
114,422MWh of thermal energy produced annually
This approach enables year-round operation and consistent indoor temperatures, demonstrating how renewables can provide stable, climate-resilient infrastructure for public amenities across all seasons. Kunlewan's four core components – an aquatic recreation centre, indoor ski hall, commercial plaza and hotels – consume around 117,708 megawatt-hours (MWh) of thermal energy annually for water heating, air conditioning, and ice and snow production. The solar mirror field captures around 114,422 MWh per year, meeting up to 97% of the demand and avoiding an estimated 38,000 tonnes of CO2 emissions annually.
As the first demonstration project integrating large-scale renewables in China's tourism sector, Kunlewan is supported by both public entities and the private sector. It is invested and developed by Handan Jianxu New Energy, established jointly by Inner Mongolia Xuchen Energy (the technical supplier and operator of the solar field) and Handan Jiaojian Zhanghe Development Co., Ltd. (a local state-owned enterprise). A total of USD 734.2 million (CNY 5.3 billion) was invested in the project, including USD 165 million (CNY 1.2 billion) ii in corporate bonds issued by Handan Construction Investment Group, a wholly state-owned enterprise.
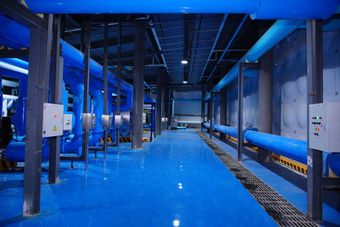
i The solar thermal capacity of the field is an estimated 77 megawatts.
ii Investment amounts are converted using exchange rates as of April 2024.
Source: See endnote 76 for this section.
TABLE 1 Top Five Countries for Total Renewable Energy Supply by Technology/Source, 2024
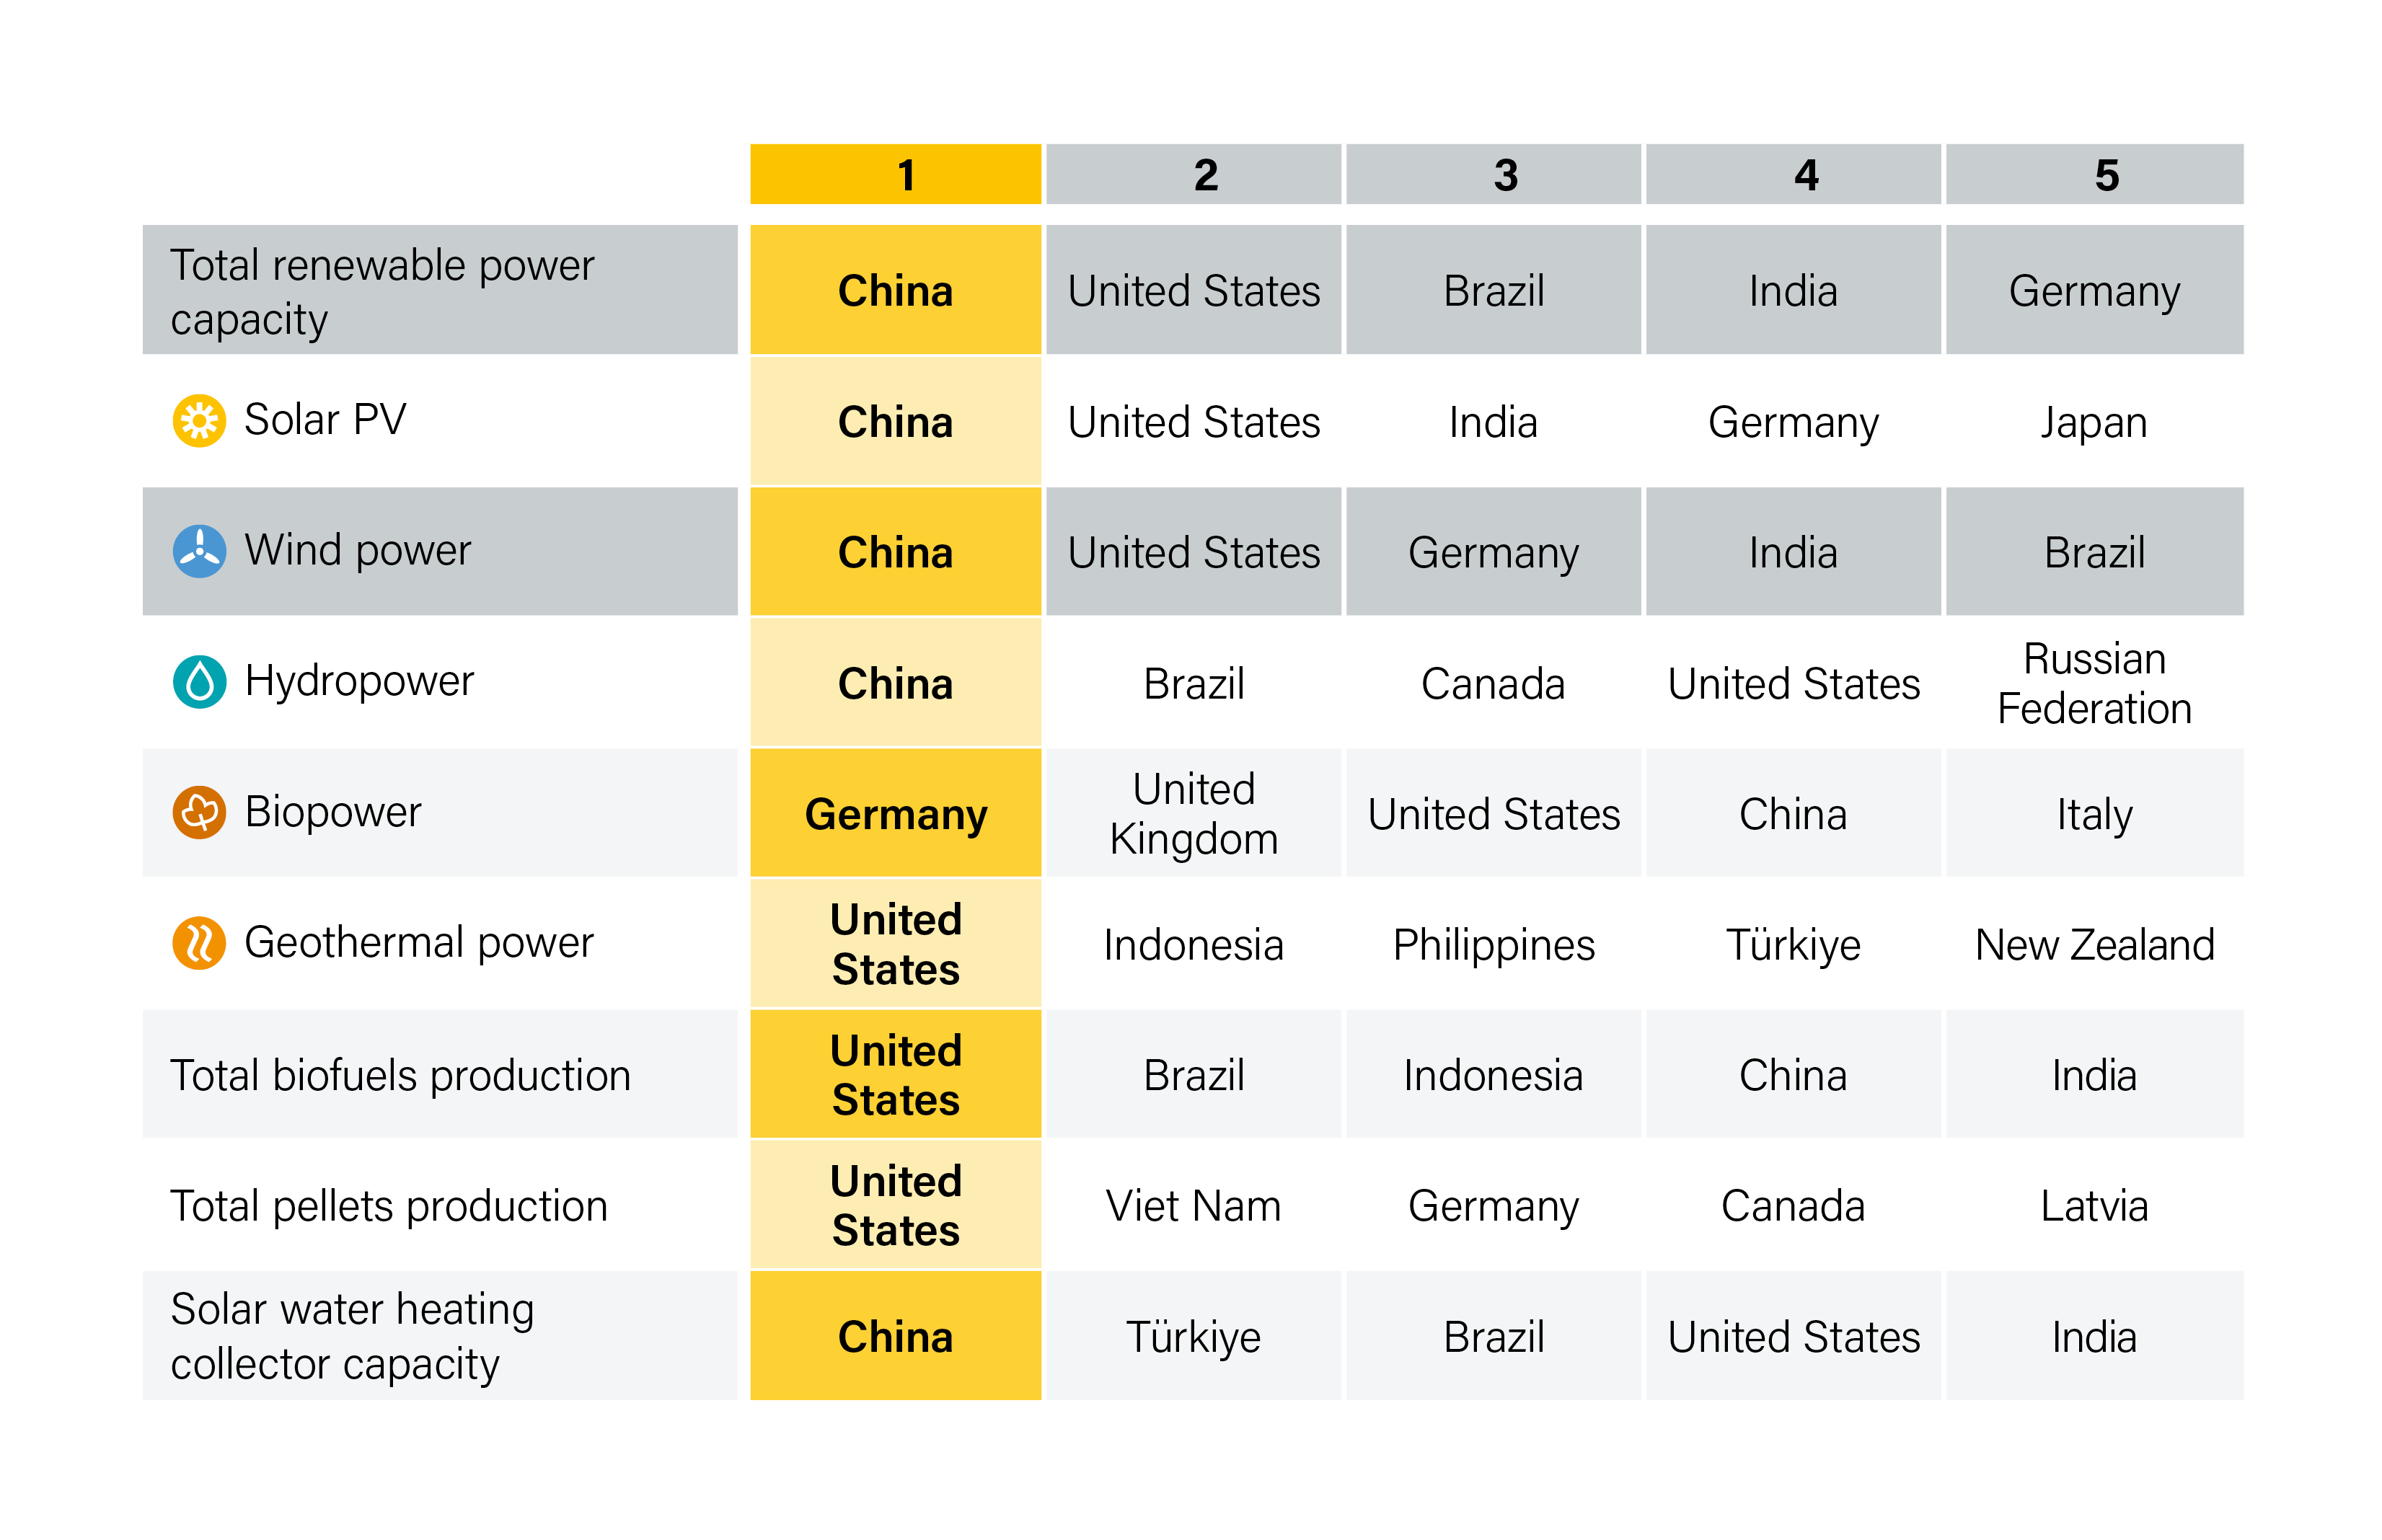
TABLE 2 Top Five Countries for Per Capita Renewable Energy Supply by Technology/Source, 2024

i The data in this section reflect wind power capacity that was newly grid-connected during 2024 and in operation by the end of 2024. Accounting for decommissioning, net additions were an estimated 114.9 GW in 2024. Including more than 9 GW of capacity that was mechanically installed in China, India and the United States, but not necessarily grid-connected, global wind power additions in 2024 were closer to 127 GW. “Mechanically installed” refers to capacity that is in place and ready to produce electricity but not officially connected to the grid. See endnote 22 for this section.
ii Green skills refer to the abilities that support environmentally sustainable practices, including those related to energy efficiency, renewable energy, waste reduction, and environmental conservation.
iii Modern renewable energy in total heat production includes modern bioenergy, renewable electricity, geothermal heat and solar heat. It excludes traditional biomass used for heating.
Energy Systems and Infrastructure
In 2024, the power sector continued to spearhead the adoption of renewable energy. During the year, 33 countries generated more than half of their electricity from renewable sources, and 15 countries successfully integrated more than 30% variable renewable electricity – solar and wind power specifically – into their electricity mix. 1 (See Figure 23.)
The power system infrastructure is evolving to support the upward trend of electrification and the integration of more distributed and variable renewable electricity into the world's grids. 2 In 2024, in addition to reinforcing and expanding transmission networks and interconnections, regulators and system operators increasingly focused on flexibility measures – including energy storage, demand response and the use of digital technologies – to ensure grid stability and reliable supply. 3
FIGURE 23 Countries with High Shares of Wind and Solar Generation in Their Power Systems, 2024

Electricity Grids
The optimisation and expansion of power networks continued to attract investment and policy attention in 2024, with total grid investment reaching USD 390 billion, up 15% compared to 2023. 4
At the November 2024 United Nations Climate Change Conference in Baku, Azerbaijan (COP 29), 65 countries signed the Global Energy Storage and Grids Pledge, committing to deploy 1,500 GW of energy storage and to develop or refurbish 25 million kilometres of grid infrastructure by 2030. 5 Additionally, 57 countries endorsed the Green Energy Zones and Corridors Pledge, which aims to accelerate the development of renewable energy and transmission infrastructure through international co-operation. 6
390USD billion total grid investment in 2024.
Meanwhile, challenges with grid congestion and connection queues continued. As of mid-2024, an estimated 1,650 GW of renewable energy capacity in advanced development stages was awaiting grid connection, up 150 GW from a year earlier. 7 Interconnection queues in the United States expanded 30% in 2023, with connection timelines tripling over a two-decade period to around five years from the request date to the commercial operation date. 8
In China, despite record investment of USD 17 billion in the first four months of 2024, power grids struggled to keep pace with wind and solar capacity additions. 9 Many counties and cities across five Chinese provinces suspended their approvals for connecting new small-scale solar projects to distribution grids during the year. 10
In the EU, to compensate for grid congestion, system operators engaged in remedial actions i covering an estimated 57.3 TWh in 2023, up 14.5% compared with 2022. 11
Policy interest has grown in pursuing system upgrades and flexibility through battery storage, demand-side response, sector coupling, the use of distributed resources and the integration of new actors such as aggregators and local energy communities in power system design. 12 Policies include mandatory long-term grid planning as well as provisions to streamline permitting, give priority status to grid expansion projects, and prioritise grid optimisation and flexibility solutions prior to grid expansion. 13 Several countries have mandated that new variable renewable energy capacity be paired with storage capacity. Market instruments such as variable network tariffs and constraint markets have emerged as tools to balance power networks. 14 (See Snapshot United Kingdom)
Grid-enhancing technologies – such as Dynamic Line Rating and Advanced Power Flow Control – progressed from pilot projects to operational deployment in 2024, and many are being integrated into utility planning and regulatory frameworks. Regulators and regional authorities (such as the US Federal Energy Regulatory Commission and the US state of Minnesota) have increasingly required the use of these technologies on transmission lines
to improve grid efficiency. 15 Utilities worldwide are deploying operational grid-enhancing technologies, including National Grid in the US state of New York, Red Eléctrica de España (REE) in Spain, the German-Dutch transmission system operator TenneT, ISA Energia in Brasil and ISA Transelca in Colombia. 16
To ensure the integration of higher shares of variable renewables – such as solar and wind power – technologies such as grid-forming batteries and inverters and the provision of virtual inertia have increasingly been integrated in grid modernisation strategies, along with demand response measures and improved forecasting. 17 Examples include the Grid Modernization Strategy of the US Department of Energy, the Inertia Report of the Australian Energy Market Operator, the System Stability & Resilience innovation priority of the UK's National Energy System Operator, the Roadmap for an Accelerated Energy Transition of Chile's power coordinator, the recommendations of the Grid Controller of India, and Eskom's (South Africa) inertia estimation tool in collaboration with the Global PST Consortium. 18
Regional interconnection projects advanced in 2024. In Africa, these included the completion of the cross-border transmission project between Burundi, Rwanda and Tanzania; the securing of funding for an interconnection line between South Sudan and Uganda; and the announcement by Eastern Africa Power Pool countries of their launch of an intraday electricity market in 2025. 19 To the north, funding for the ELMED interconnection project between Tunisia and Italy advanced through a loan from the European Investment Bank, and an interconnection line between Iraq and Türkiye started operating. 20
In South America, Ecuador and Peru launched a tender for a new interconnector, and in Central Asia, Azerbaijan, Kazakhstan and Uzbekistan signed a memorandum of understanding to connect their power systems through an undersea high-voltage cable. 21

Snapshot: United Kingdom
Local flexibility Market to tackle grid bottlenecks
Constraints refer to limitations in the transmission network that lead the system operator to force electricity producers to reduce their output in instances where generation is higher than the network's capacity. In recent years, grid constraints have been notable in the UK, especially between Scotland and England. The costs of these constraints – paid by the National Energy System Operator (NESO) – USD 2.2 billion (GBP 1.6 billion) for the financial year 2022-2023 i .

As part of the strategy to address these rising costs over the short term, NESO has set up the Local Constraint Market (LCM), wherein electricity users and producers in specific areas propose bids to increase or decrease their electricity use or generation at certain times. The market was designed to be open to a wider range of participants than the traditional Balancing Mechanism (BM), NESO's main tool to maintain real-time balance between electricity supply and demand. The BM works on an “intraday” basis by asking generators or consumers to adjust their output every half hour. Only participants formally registered in the BM can take part.
Consumers and producers propose bids to increase or decrease their electricity use and generation to adapt to grid limitations.
In contrast to the Balancing Mechanism, the Local Constraint Market allows participation from flexibility providers that may not be part of the Balancing Mechanism. These include energy suppliers, aggregators and other companies capable of adjusting their electricity use or generation locally. Many of these are also participants in the Capacity Market, which ensures that enough capacity is available at peak times. The LCM is a day-ahead market, and as such it offers the potential to reduce the volume and cost of actions required in the BM the following day.
In 2024, NESO ran a pilot initiative where households in Scotland adjusted the timing of their electricity use to absorb excess wind power generation. Over a 10-day period, 3 megawatts of demand response was contracted. In 2025, NESO continued its work to expand and improve the LCM.
i The largest proportion of constraint costs are payments to fossil gas generators, typically to increase output to meet demand and to replace constrained generation elsewhere. According to some estimations, payments to fossil gas generators accounted for 76% of constraint costs during the period January to September 2024.
Source: See endnote 14 for this section.
Energy Storage
Energy storage systems - such as batteries, pumped storage, thermal storage and hydrogen - can help stabilise power grids, especially in the context of increased penetration of variable renewables. Battery energy storage systems were the fastest growing energy storage technology in 2024. An estimated 69 GW of new battery storage capacity was deployed globally during the year, bringing the total installed capacity to an estimated 150 GW. 22 The grid-connected segment accounted for 78% of this growth. 23 (See Figure 24.)
China led in battery storage deployment with 67% of global new installations, driven by provincial policies requiring battery capacity to be co-located with new solar and wind power installations. 24 The United States and Canada were the second largest contributors of battery capacity, with the United States adding 10.4 GW for a total of 26 GW nationwide. 25 Strong growth also occurred in Europe, Latin America and the rest of the Asia Pacific region. 26
Both the capacity of battery installations and the duration ii increased during the year. Altogether, around 17 installations of more than 1 GW were deployed in 2024, up from only 4 a year earlier, and an estimated 140 projects of more than 1 GW each were planned for 2025 and 2026. 27 In Europe, the average duration of battery storage increased from 1.4 hours in 2023 to 2.0 hours in 2024, whereas in the United States and Canada the average duration of new installations in 2024 was 3.0 hours. 28
54b Global investment in stationary energy storage projects in 2024.
Global investment in stationary energy storage projects (excluding pumped storage and hydrogen) increased 36% in 2024 to reach USD 54 billion. 29 Meanwhile, the global average cost for battery storage projects dropped by one-third to USD 104 per megawatt-hour, driven by the lower price of battery packs due to oversupply caused by slowing sales of electric vehicles. 30
Pumped storage remained the leading energy storage technology in 2024, with 189 GW of global installed capacity. 31 Capacity additions during the year totalled 8.4 GW, an increase of 4.5% compared to 2023. 32
FIGURE 24 Energy Storage Capacity by Type, 2023 and 2024
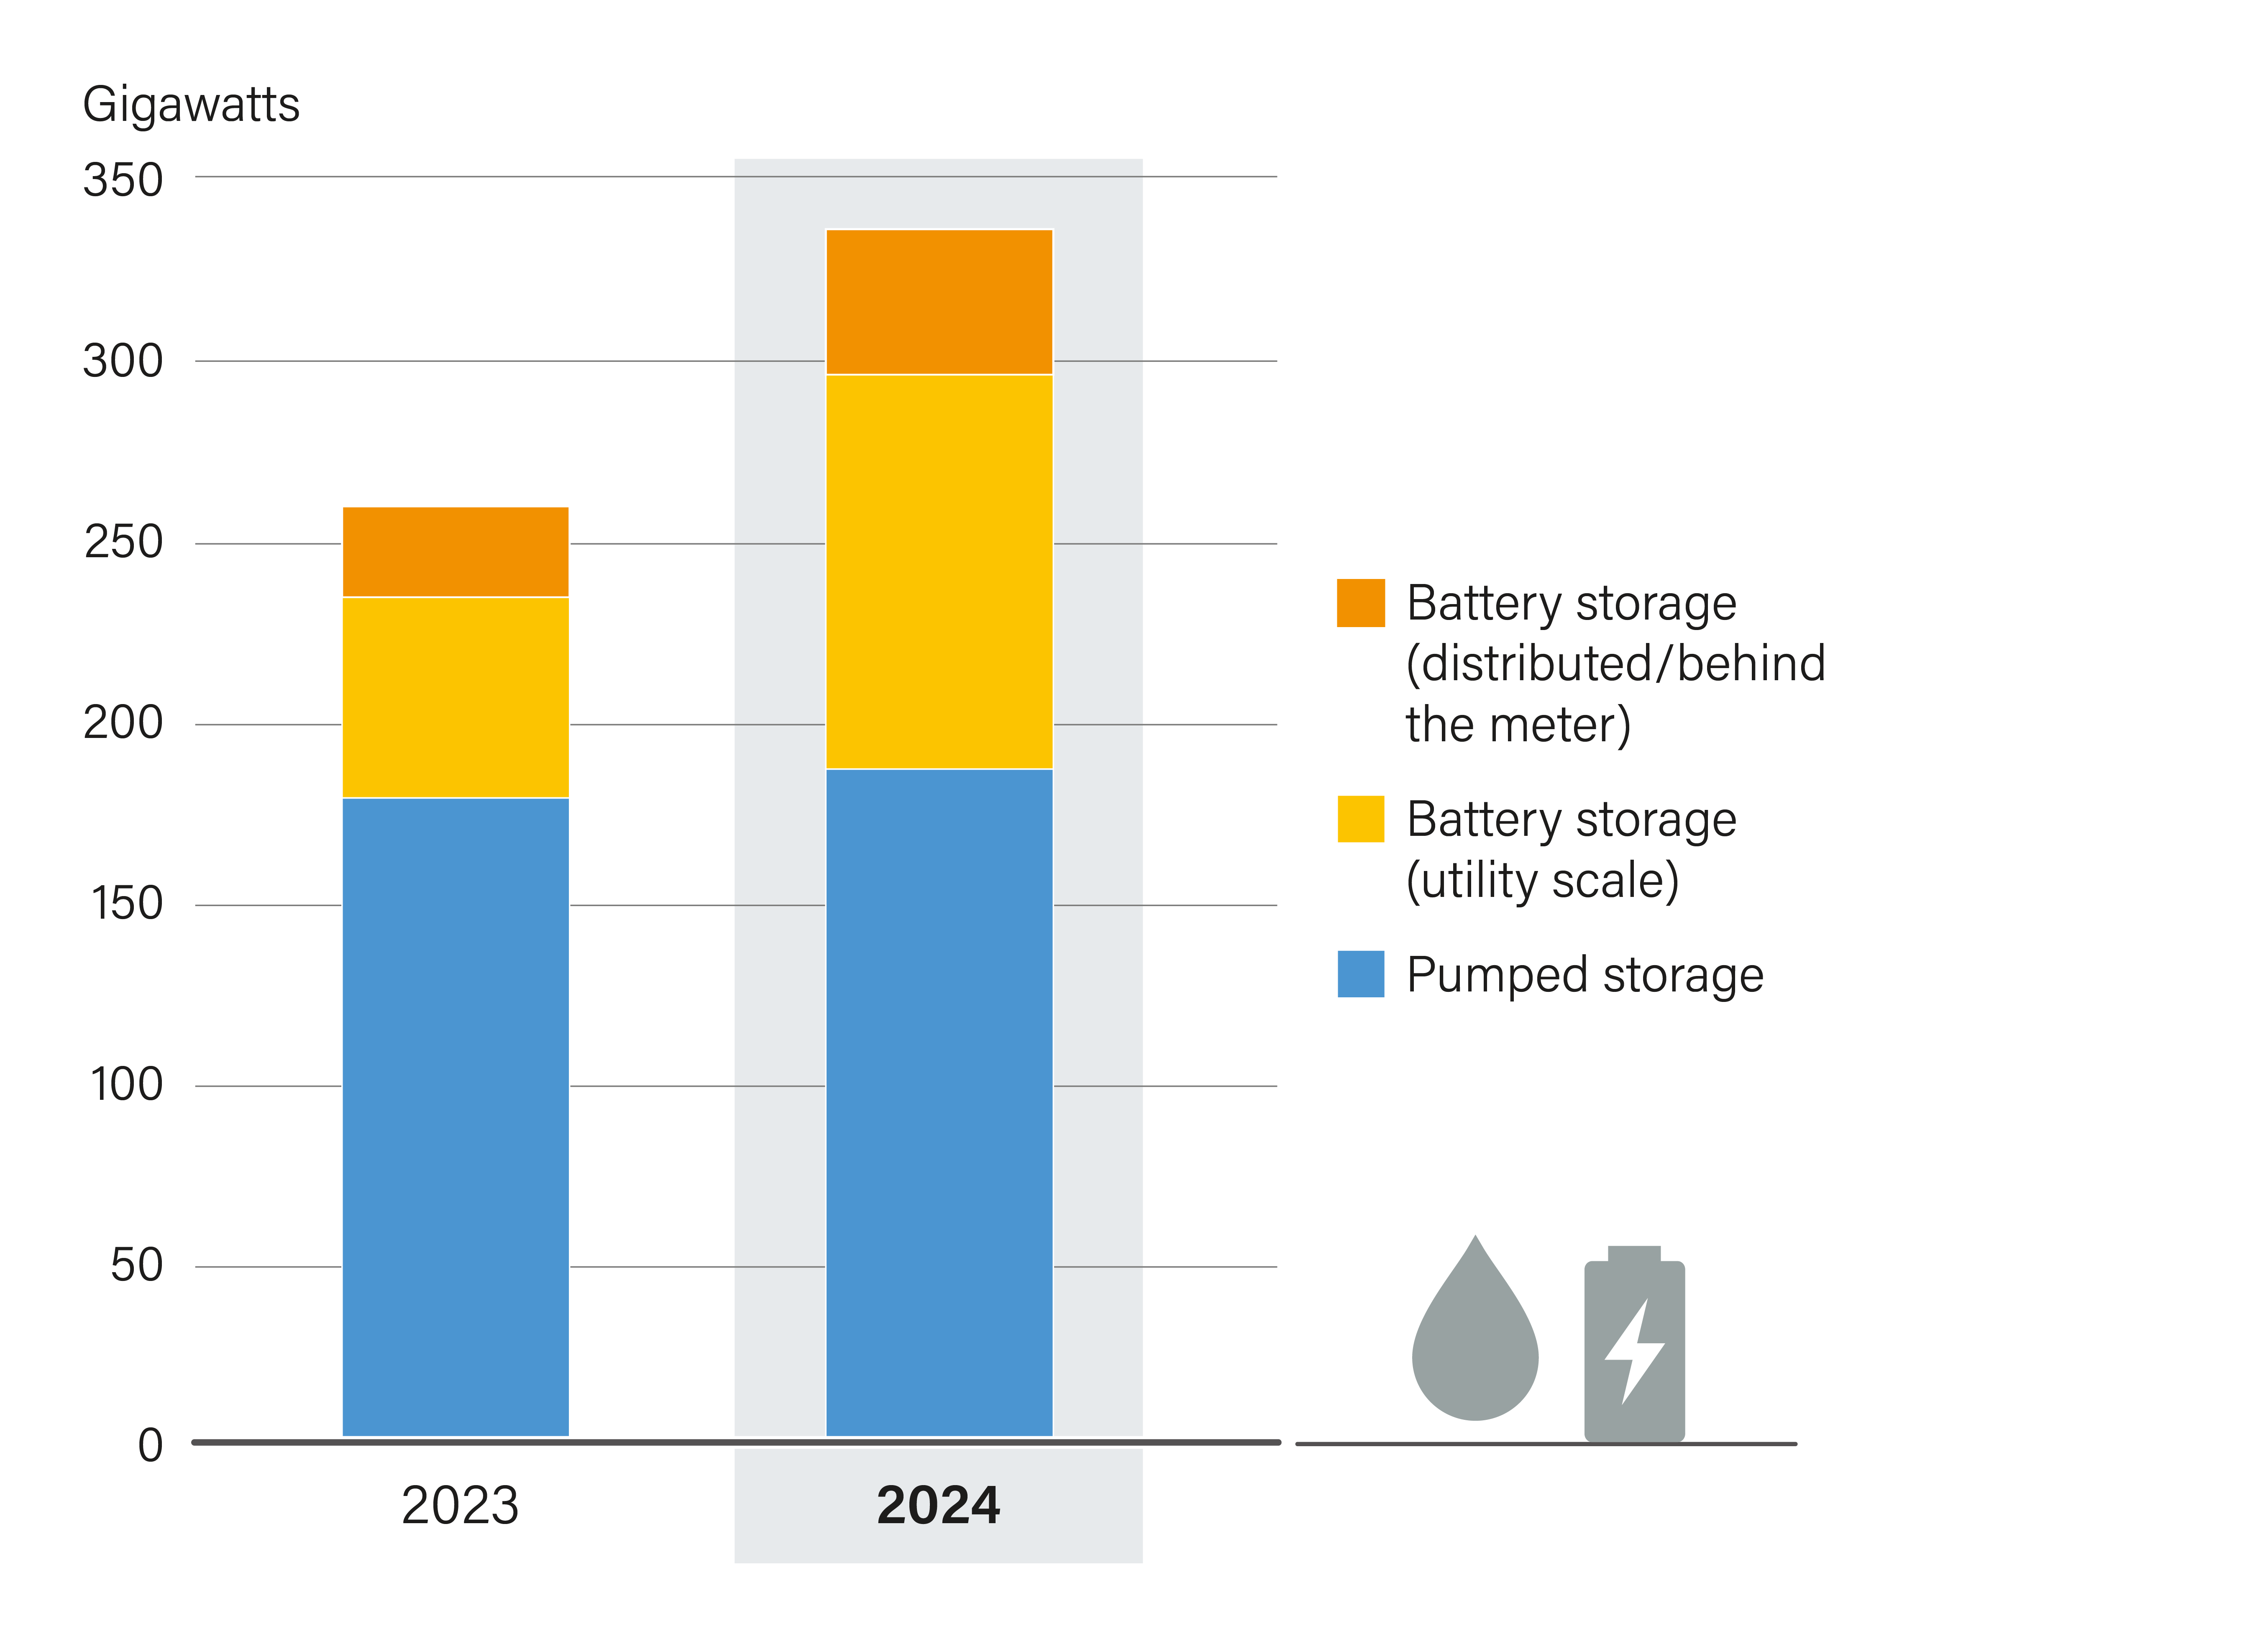
Thermal storage continued to gain attention in the industry sector, with projects focused on high-temperature energy storage. The global market for thermal energy storage systems was valued at USD 54.4 billion in 2024, up from USD 47.5 billion in 2023. 33
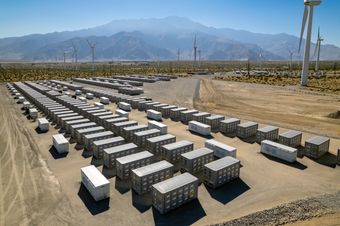
By the end of 2024, at least 26 countries had announced or enacted policies to support energy storage (See Figure 25), a slight increase over 2023. 34 Although more than half of these countries had established targets for energy storage, the most common policy type was fiscal and financial incentives. Existing policies focus mainly on battery storage, including incentives for increased battery capacity to support grid stability, as well as support for the development of a domestic manufacturing industry. 35
Incentives for energy storage were aimed mainly at both utility-scale and household-level battery storage development. Much less policy attention in 2024 went to pumped storage (with 5 countries setting new specific policies) and thermal storage (only 1 country). 36 Policy makers have increasingly explored long-duration energy storage iii technologies, with both the United Kingdom and New South Wales in Australia introducing mechanisms to support their development in early 2025. 37
FIGURE 25 Countries with Targets, Regulations and Financial Incentives for Energy Storage, as of 2024
Hydrogen
In 2023, renewables-based hydrogen accounted for less than 1% of total global hydrogen production, with the vast majority of the world's hydrogen still being produced from fossil gas and around 20% from coal. 38 In 2024, investment in renewable hydrogen fell 42% relative to 2023, to USD 8.4 billion. 39 This sharp decline reflects growing uncertainty about the market readiness of the technology and the ability to lower overall costs. According to some estimations, only 12% of hydrogen projects that are considered “low carbon” iv globally have secured purchase agreements with potential customers. 40
As of mid-2025, a total of 55 countries had enacted, planned or announced green hydrogen v policies (See Figure 26), of which 14 were announced or enacted in 2024 and early 2025. 41 An important share of these policies focus on the development of national hydrogen industries and do not target specific end-use sectors. Policies targeting end-use sectors mostly address transport, followed by the industry sector, whereas the buildings and agriculture sectors are only marginally represented in hydrogen strategies. 42
Fiscal and financial incentives increasingly entered the hydrogen policy landscape in 2024 and early 2025, a change from previous years when countries focused mainly on setting targets through strategies and roadmaps. Although some countries (such as Greece) increased the ambition of their hydrogen targets in 2024, others reduced it (for example, Portugal lowered its 2030 target from 5.5 GW to 3 GW). 43 At least four countries – Chile, India, Morocco and Oman – set specific measures to secure land for hydrogen production. 44
FIGURE 26 Countries with Policies for Renewable Hydrogen Development, by End-use Sector, as of Mid-2025
Most policies do not target specific end-use sectors.
Policies targeting specific end-use sectors mostly address transport, followed by the industry sector. Buildings and agriculture are only marginally represented in hydrogen strategies. Note: “Sector specific” refers to policies that specifically target an end-use sector for hydrogen: agriculture, buildings, industry or transport. Based on REN21 Policy Database, updated in December 2024
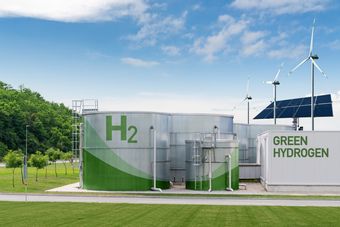
i Remedial actions are defined by the European Commission as "any measure applied by a TSO [Transmission System Operator] or several TSOs, manually or automatically, in order to maintain operational security". See endnote 11.
ii Refers to systems with a discharge duration of above 8 hours, although this duration can vary according to diverse definitions.
iii Definitions of “low carbon” hydrogen vary: while they all include renewable energy, some also include other technologies such as nuclear energy or fossil fuel projects with carbon capture and storage.
iv Green hydrogen is defined as hydrogen produced using electrolysis, powered from renewable sources. See endnote 41.

RENEWABLES IN ENERGY DEMAND
Setting a record annual growth for the decade, the world's total final energy consumption (TFEC) increased 2.2% in 2024. 1 This growth was driven in part by rising energy demand in emerging economies and a surge in electricity use, due largely to record-high temperatures increasing the need for space cooling, the expansion of data centres, and growing electrification in energy-intensive manufacturing activities and transport. 2
Despite overall absolute growth in renewable energy demand, the share of renewables in the end-use sectors of industry, buildings, agriculture and transport remained low at 13.4% in 2022 (latest data available), up slightly from 12.7% in 2021. 3 (See Figure 27.) In terms of percentage points, the renewable energy share grew 1.33% in the agriculture sector, 1.72% in the buildings sector, and 1.28% in the industry sector, with the share in the transport sector showing almost no change in 2022. 4
SECTORAL TRENDS
The industry sector accounted for 34% of TFEC in 2022, and the share of renewable energy use in industry was the highest among the sectors, at 18.1% (up from 16.8% in 2021 and 12.7% in 2012). 5 The largest energy consumers in the industrial sector in 2022 were the iron and steel and chemicals and petrochemicals sub-sectors (which together accounted for 33% of industrial consumption), followed by non-metallic minerals (such as glass, ceramic and cement) at 12.8%. 6 Other key consumers were food and tobacco (6.5%), non-ferrous metals (5.7%), paper pulp and printing (5.4%) and mining and quarrying (2.6%). 7 China accounted for more than 38% of the industry sector's global energy use, followed by the United States and India, with 9.6% and 9.3% respectively. 8

73.8% was the share of heat in the industry sector total final energy consumption in 2022.
Heat consumption represented 73.8% of the industry sector's total final energy consumption in 2022, of which 87.6% was from fossil fuels and 12.4% from renewables i . 9 The renewable energy mix of the heat consumed by industries was dominated by modern bioenergy at 89%, followed by electric heat (10.4%) and very small shares of solar and geothermal heat (0.1% and 0.2%, respectively). 10
The buildings sector accounted for 31% of TFEC in 2022, with a renewable energy share of 17.7%, up from 12.1% a decade earlier. 11 This reflects an increase in the direct use of renewables in buildings, as well as the higher penetration of renewables in the power sector. 12 The main energy consumers in buildings are thermal uses, such as heating, domestic hot water, cooking and cooling spaces. Although heat accounts for most of the energy consumption in buildings, cooling is the fastest growing end use and was the main driver of rising electricity demand in the sector in 2024. 13
Global energy consumption in the buildings sector fell slightly in 2023, due mainly to warmer winters and lower heating demand, which was offset in part by increases in other end uses. 14 Meanwhile, electricity use in buildings is rising: in 2024, the buildings sector accounted for nearly 60% of the overall growth in electricity consumption. 15 Factors included heatwaves leading to growing demand for space cooling in countries such as India and China, and rising electricity demand from data centres. 16 (See Box 1.) The United States, European Union (EU) and China together accounted for almost half of all energy consumption in buildings in 2023. 17
FIGURE 27 Renewable Share of Total Final Energy Consumption (TFEC), by Sector, 2022

Box 1. Impacts of AI and Data Centres on Rising Electricity Demand
Artificial intelligence (AI) applications and digital infrastructures have emerged as structural forces that are reshaping global electricity demand, presenting challenges to power system planning, sustainability targets and energy resilience in key regions. As of 2022, data centres and data transmission networks each accounted for around 1% to 1.5% of total global electricity consumption, driven by the growth in digital services and cloud computing in recent years.

Global electricity demand rose 4% between 2023 and 2024, compared to an annual average growth rate of 2.5% over the previous decade. Electricity demand from data centres and cryptocurrency mining increased by an estimated 20% (or 111 terawatt-hours) in 2024 alone. This contributed around 0.4% to the total global growth in electricity demand, with cryptocurrency mining accounting for around 40% of this increase.
Large language models (LLMs) for AI applications are trained on vast datasets using power-intensive processors and large-scale computing infrastructure. While more efficient techniques and training methods are under development, such as DeepSeek's sparse computing approach, the increasing size and complexity of AI models continue to drive overall energy consumption.
Asia Pacific and North America host the largest concentrations of data centre capacity in terms of power demand, with major hubs including Beijing and Shanghai in China, and the US regions of Northern Virginia and the San Francisco Bay Area. Data centres also add significant demands in other markets: in Ireland, they accounted for 21% of total electricity demand in 2023, up from 5% in 2015.
Increased pressure on grid infrastructure is influencing national planning and regulatory responses. Several jurisdictions – including Amsterdam (Netherlands), China, Germany, Ireland, Singapore and a US county – have introduced restrictions on new data centre connections to manage the load and to comply with environmental requirements.
Looking ahead, electricity demand from data centres globally could rise an estimated 160-165% by 2030 compared to 2022, according to some projections. In Europe, this demand could increase overall regional electricity consumption up to 30%. Despite improvements in facility-level energy efficiency, electricity demand from AI and data centres is expected to continue surging over the next decade.
Data centre in Chongqing, China
Source: See endnote 16.
Energy efficiency in buildings improved 2.6% globally in 2023, a significant increase compared to the average 1.4% annual improvement seen in the previous decade. 18 Overall growth in energy demand overshadowed improvements in energy efficiency. 19
The agriculture sector – which includes agriculture, fisheries and forestry – represented 2.5% of TFEC in 2022, up from 2.2% in 2021. 20 China alone accounted for one-fifth (20.1%) of this consumption, and Brazil, the EU, India and the United States together made up 41%. 21 Nearly three-quarters of the energy consumed in the agriculture sector is in the form of heat, of which 10% is renewable; almost all of this is modern bioenergy, with some geothermal, while solar thermal heating remains limited. 22
The share of renewables in the agriculture sector's TFEC in 2022 was 17.8%, up from 11.4% in 2012. 23 The main energy uses in the sector are machinery ii (used in land preparation, planting, pumping and irrigation, harvesting and on-farm storage) and the warming of greenhouses and livestock housing. 24
The transport sector represented 31% of TFEC in 2022. 25 The share of renewables in the sector was below 4%, with minimal growth over the decade 2012-2022. 26 Of the modern renewables used in the sector in 2022, biofuels represented the vast majority (3.5% of TFEC), while renewable electricity made up only 0.4%. 27 During the decade, overall transport energy demand grew 12%, and non-renewable energy use in the sector rose 11%. 28
DRIVERS OF RENEWABLE ENERGY ADOPTION
Electrification
A key vector for renewable energy adoption in demand sectors is the electrification of end uses, including through the uptake of technologies such as heat pumps, electric vehicles and electric arc furnaces. 29 In 2022, the share of electricity in the world's TFEC was 23%, up slightly from 22% in 2020. 30 (See Figure 28.)
Electricity accounted for 29.0% of the industry sector TFEC in 2022 (renewable electricity was 9.3% of TFEC). 31 High-temperature industrial processes remain heavily reliant on fossil fuels, despite technological advances in electrification, such as industrial heat pumps and electric steam crackers. 32 Non-energy-intensive sectors have electrified more rapidly. The technologies needed to electrify heavy industries are still in early development stages, and the sector may suffer from a lock-in of assets due to significant upfront investments. 33
In the buildings sector, the adoption of electric appliances such as heat pumps for heating and cooling can drive up the overall electricity share, which reached 26% of TFEC in 2022 (11.3% of TFEC was renewable electricity). 34 Heat pump sales fell 1% globally in 2024, reflecting a sharp 10% decline in the first half of the year. 35 In the second half of the year, sales recovered strongly in some regions, such as the United States (up 15%) and Japan (up 5%), but this increase was not sufficient to compensate for the decline in Europe (down 21%) and the lack of growth in China. 36 Possible reasons for the European sales decline include the slowdown of the construction sector, high prices of electricity compared to fossil gas and uncertainty about supporting policies. 37
The highest share of electricity in TFEC was in the agriculture sector, accounting for 30.7% in 2022 (renewable electricity was 9.8% of TFEC). 38 Electrification can be advanced by switching to electric agricultural equipment (such as tractors and water pumps). The share of renewables in the electricity supply is supported by increases in on-farm renewable electricity generation. 39
FIGURE 28 Electricity and Renewable Electricity Shares of Total Final Energy Consumption, by End-Use Sector, 2012 and 2022
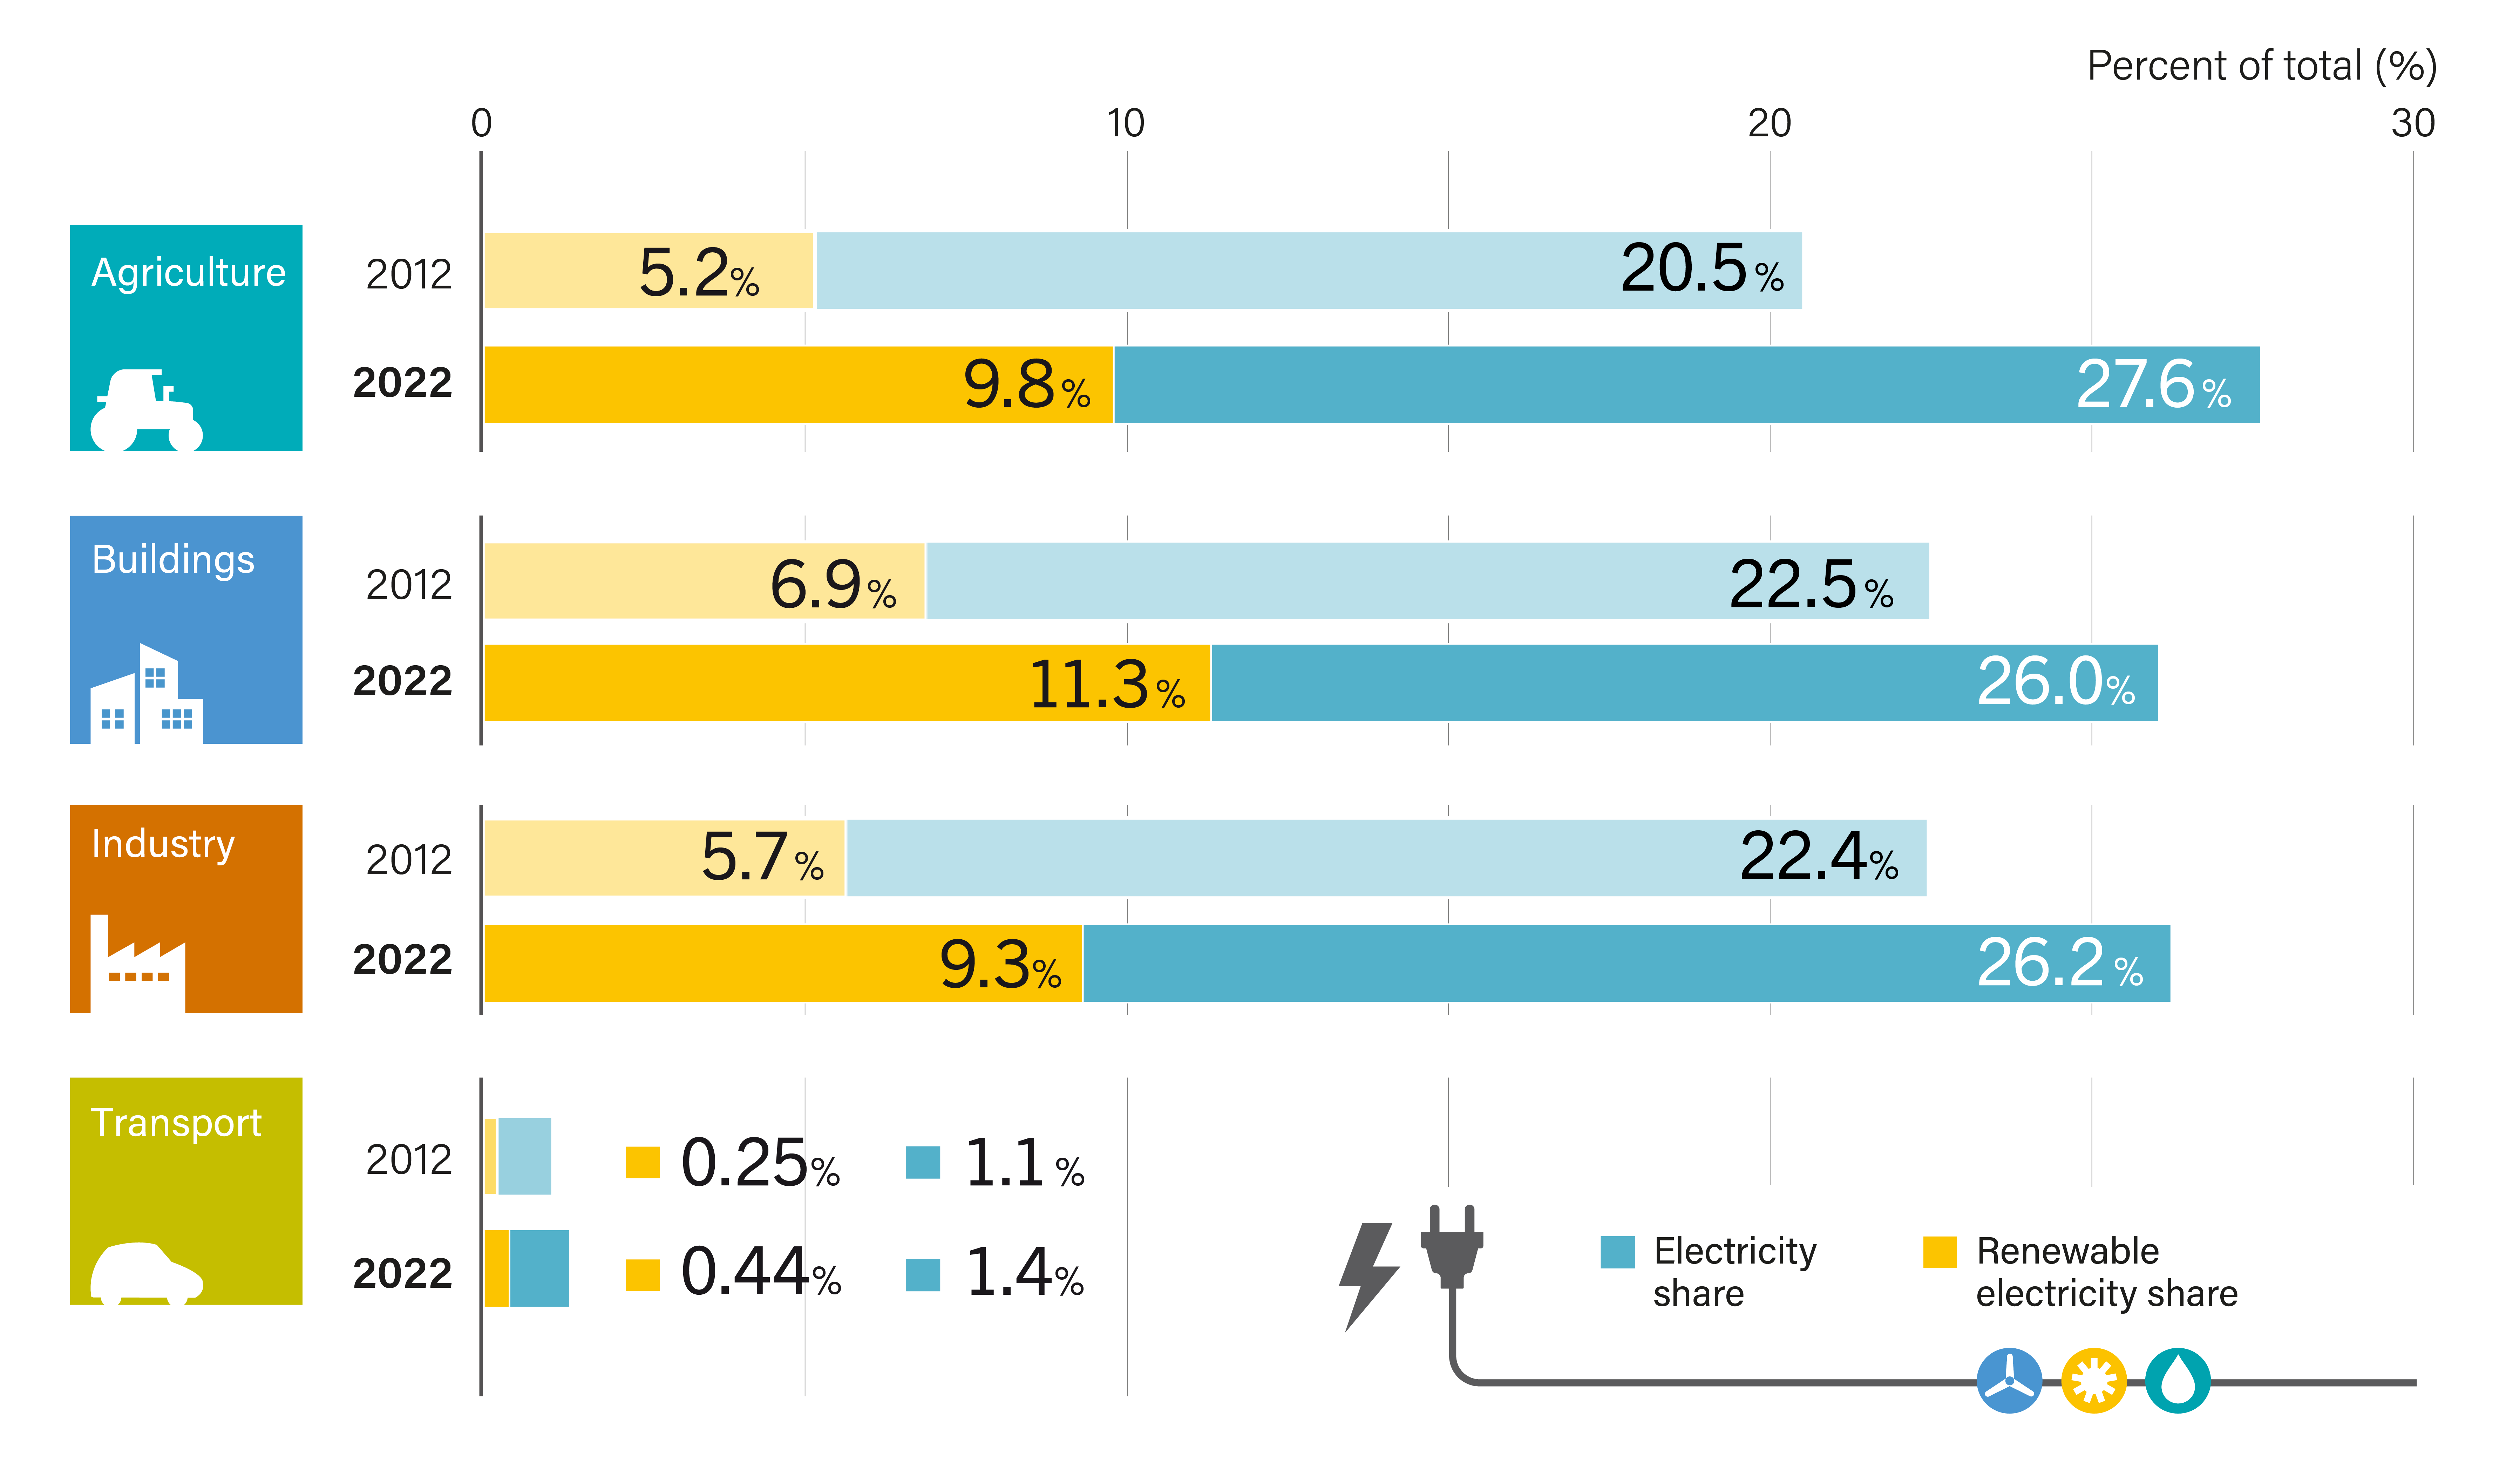
In 2023, the global installed solar water pump capacity reached 1.1 gigawatts (GW), up 1.8% from 2022. 40 India was home to 94% of this capacity. 41 Globally, however, diesel fuel accounts for nearly three-quarters (74%) of the energy used for water pumping. 42 The biggest challenge to the widespread adoption of solar irrigation systems is affordability. Other factors that influence farmers' willingness to adopt electric machinery include upfront costs, machine sizes, battery autonomy and the availability of charging infrastructure. 43
The transport sector has the lowest electrification rate of all demand sectors in 2022, at 1.4% of TFEC, with renewable electricity representing 0.4% of TFEC. However renewable electricity use in the sector grew 15% in 2022. 44 Electrification of transport relies heavily on the adoption of electric vehicles and the availability of charging infrastructure.
Electric vehicle sales continued an upward trend in 2024, with more than 17 million units sold globally, representing more than one-fifth of global car sales. 45 Electric vehicle adoption is expanding beyond China (the leading market) and high-income countries, with record sales reported in emerging economies such as Brazil, India, Thailand and Türkiye. 46
The number of charging points globally has doubled since 2022. 47 Electrification of rail transport also advanced, with many countries and regions exploring rail development and electrification. 48 India, the world's fourth biggest railway network, achieved 98.8% rail electrification by the end of 2024, and China, the second largest rail network, reached 75% as of 2023. 49
The industry sector accounted for almost 50% of China's electricity demand growth between 2022 and 2024.
By country, China had the highest share of electricity in its TFEC, and the fastest rate of electrification, growing from 22.3% in 2012 to 31.7% in 2022. 50 The industry sector was responsible for almost 50% of the surge in China's electricity demand between 2022 and 2024 (with solar PV manufacturing accounting for one-third of this increase). 51 The buildings sector, including growing demand for cooling, accounted for 40% of the growth in China's electricity demand. 52 While the share of renewables in China is rising steadily, the country depended on fossil fuels for 62% of its electricity generation as of 2024. 53 India, another major energy-consuming country, also showed an upward electrification trend from 2012 to 2022, with economic expansion and a surging interest in cooling driving the increase in electricity demand. 54 (See Figure 29.)
FIGURE 29 Share of Electricity in Total Final Energy Consumption in Major Country/Region, 2013-2022
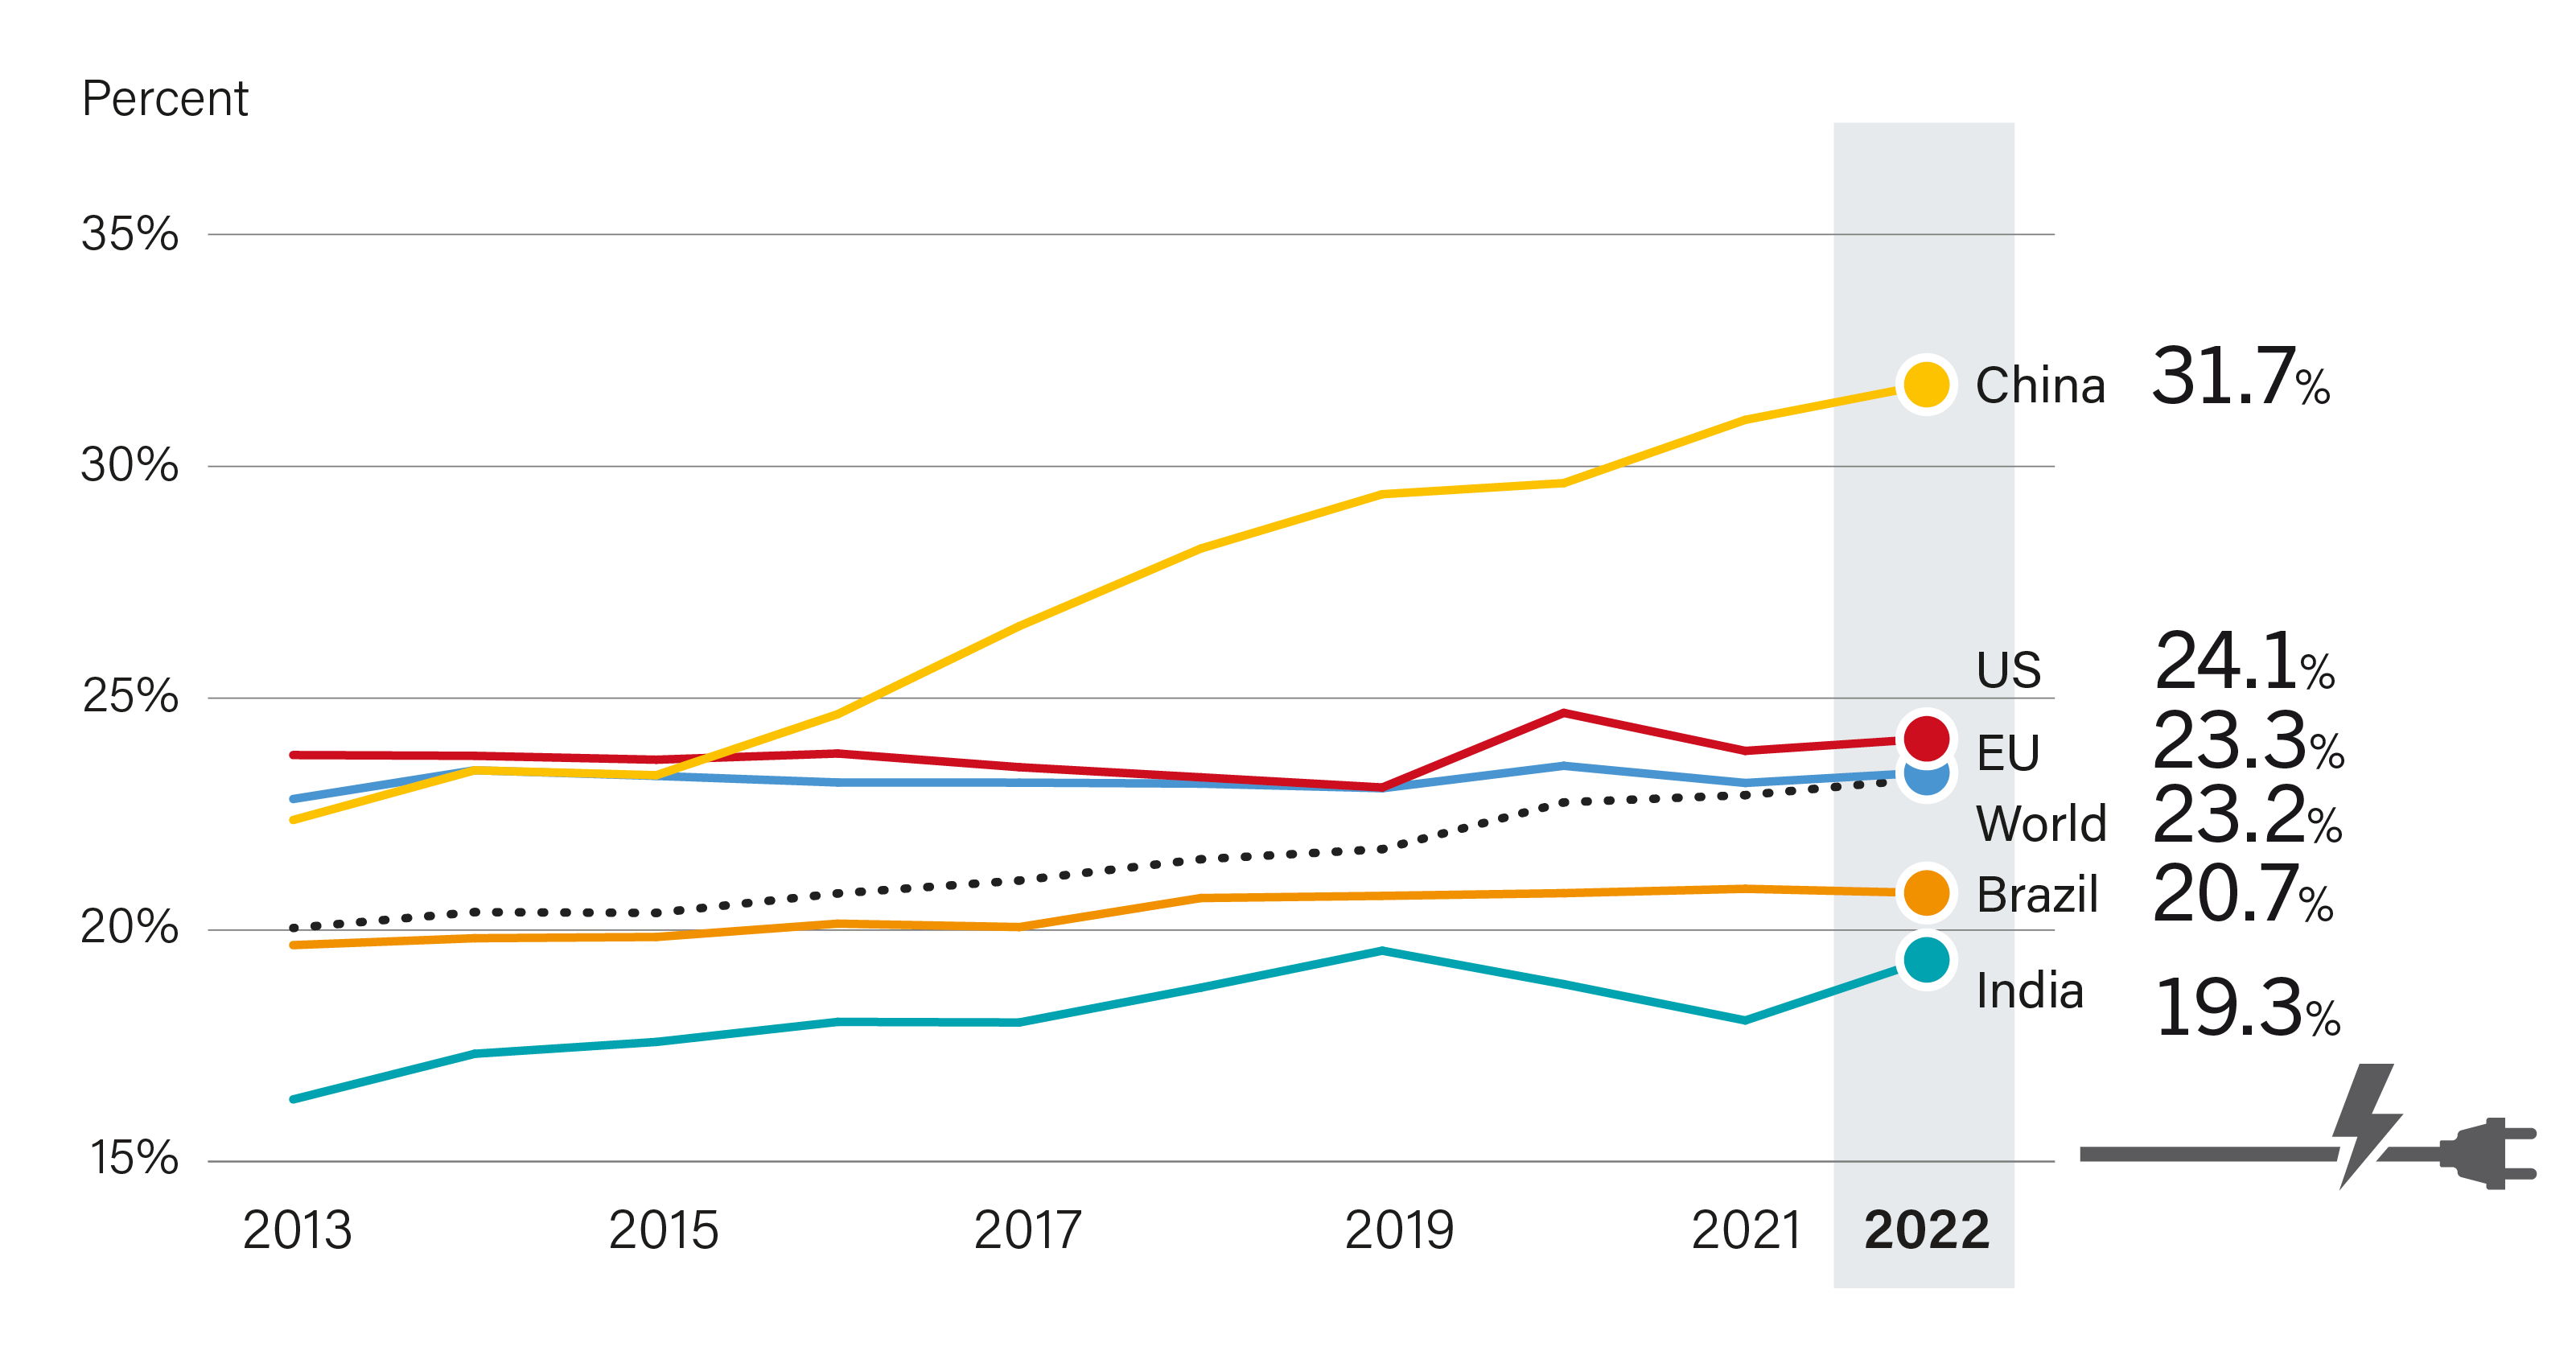
Demand from Private Actors
The private sector emerges as an important leader in the global uptake of renewables — especially renewable electricity — in demand sectors, through the adoption of electricity purchase agreements (PPAs) and the deployment of small-scale solar PV for self-consumption. 55
Corporate PPAs rose 35% in 2024. 56 Growth was driven mainly by the appetite of technology companies to secure power supply for data centres, although the industry and services sectors also increasingly signed long-term power supply contracts. 57 (See Sidebar 7.)

The adoption of small-scale solar PV systems by companies and households has surged in several regions in response to high electricity prices and sometimes unreliable grid services. 58 Pakistan was the top destination for exports of Chinese solar PV modules in fiscal year 2024, amounting to an estimated USD 2.1 billion. 59 The main end users were industry, agriculture, and buildings, mostly for self-consumption. 60 In Lebanon, private households and businesses have driven a spectacular increase in solar PV installations, rising from 100 megawatts (MW) in 2020 to 1,300 MW in 2023. 61 In South Africa, the national utility Eskom reported capacity additions of behind-the-meter solar PV of 273 MWpeak per month on average between March and September 2023. 62 In Türkiye, 90% of solar PV installations during 2021-2025 were small-scale, licence-exempt power plants, primarily for self-consumption. 63
FIGURE 30 Corporate Renewable Power Purchase Agreements, Global Capacity and Annual Additions, 2015-2024
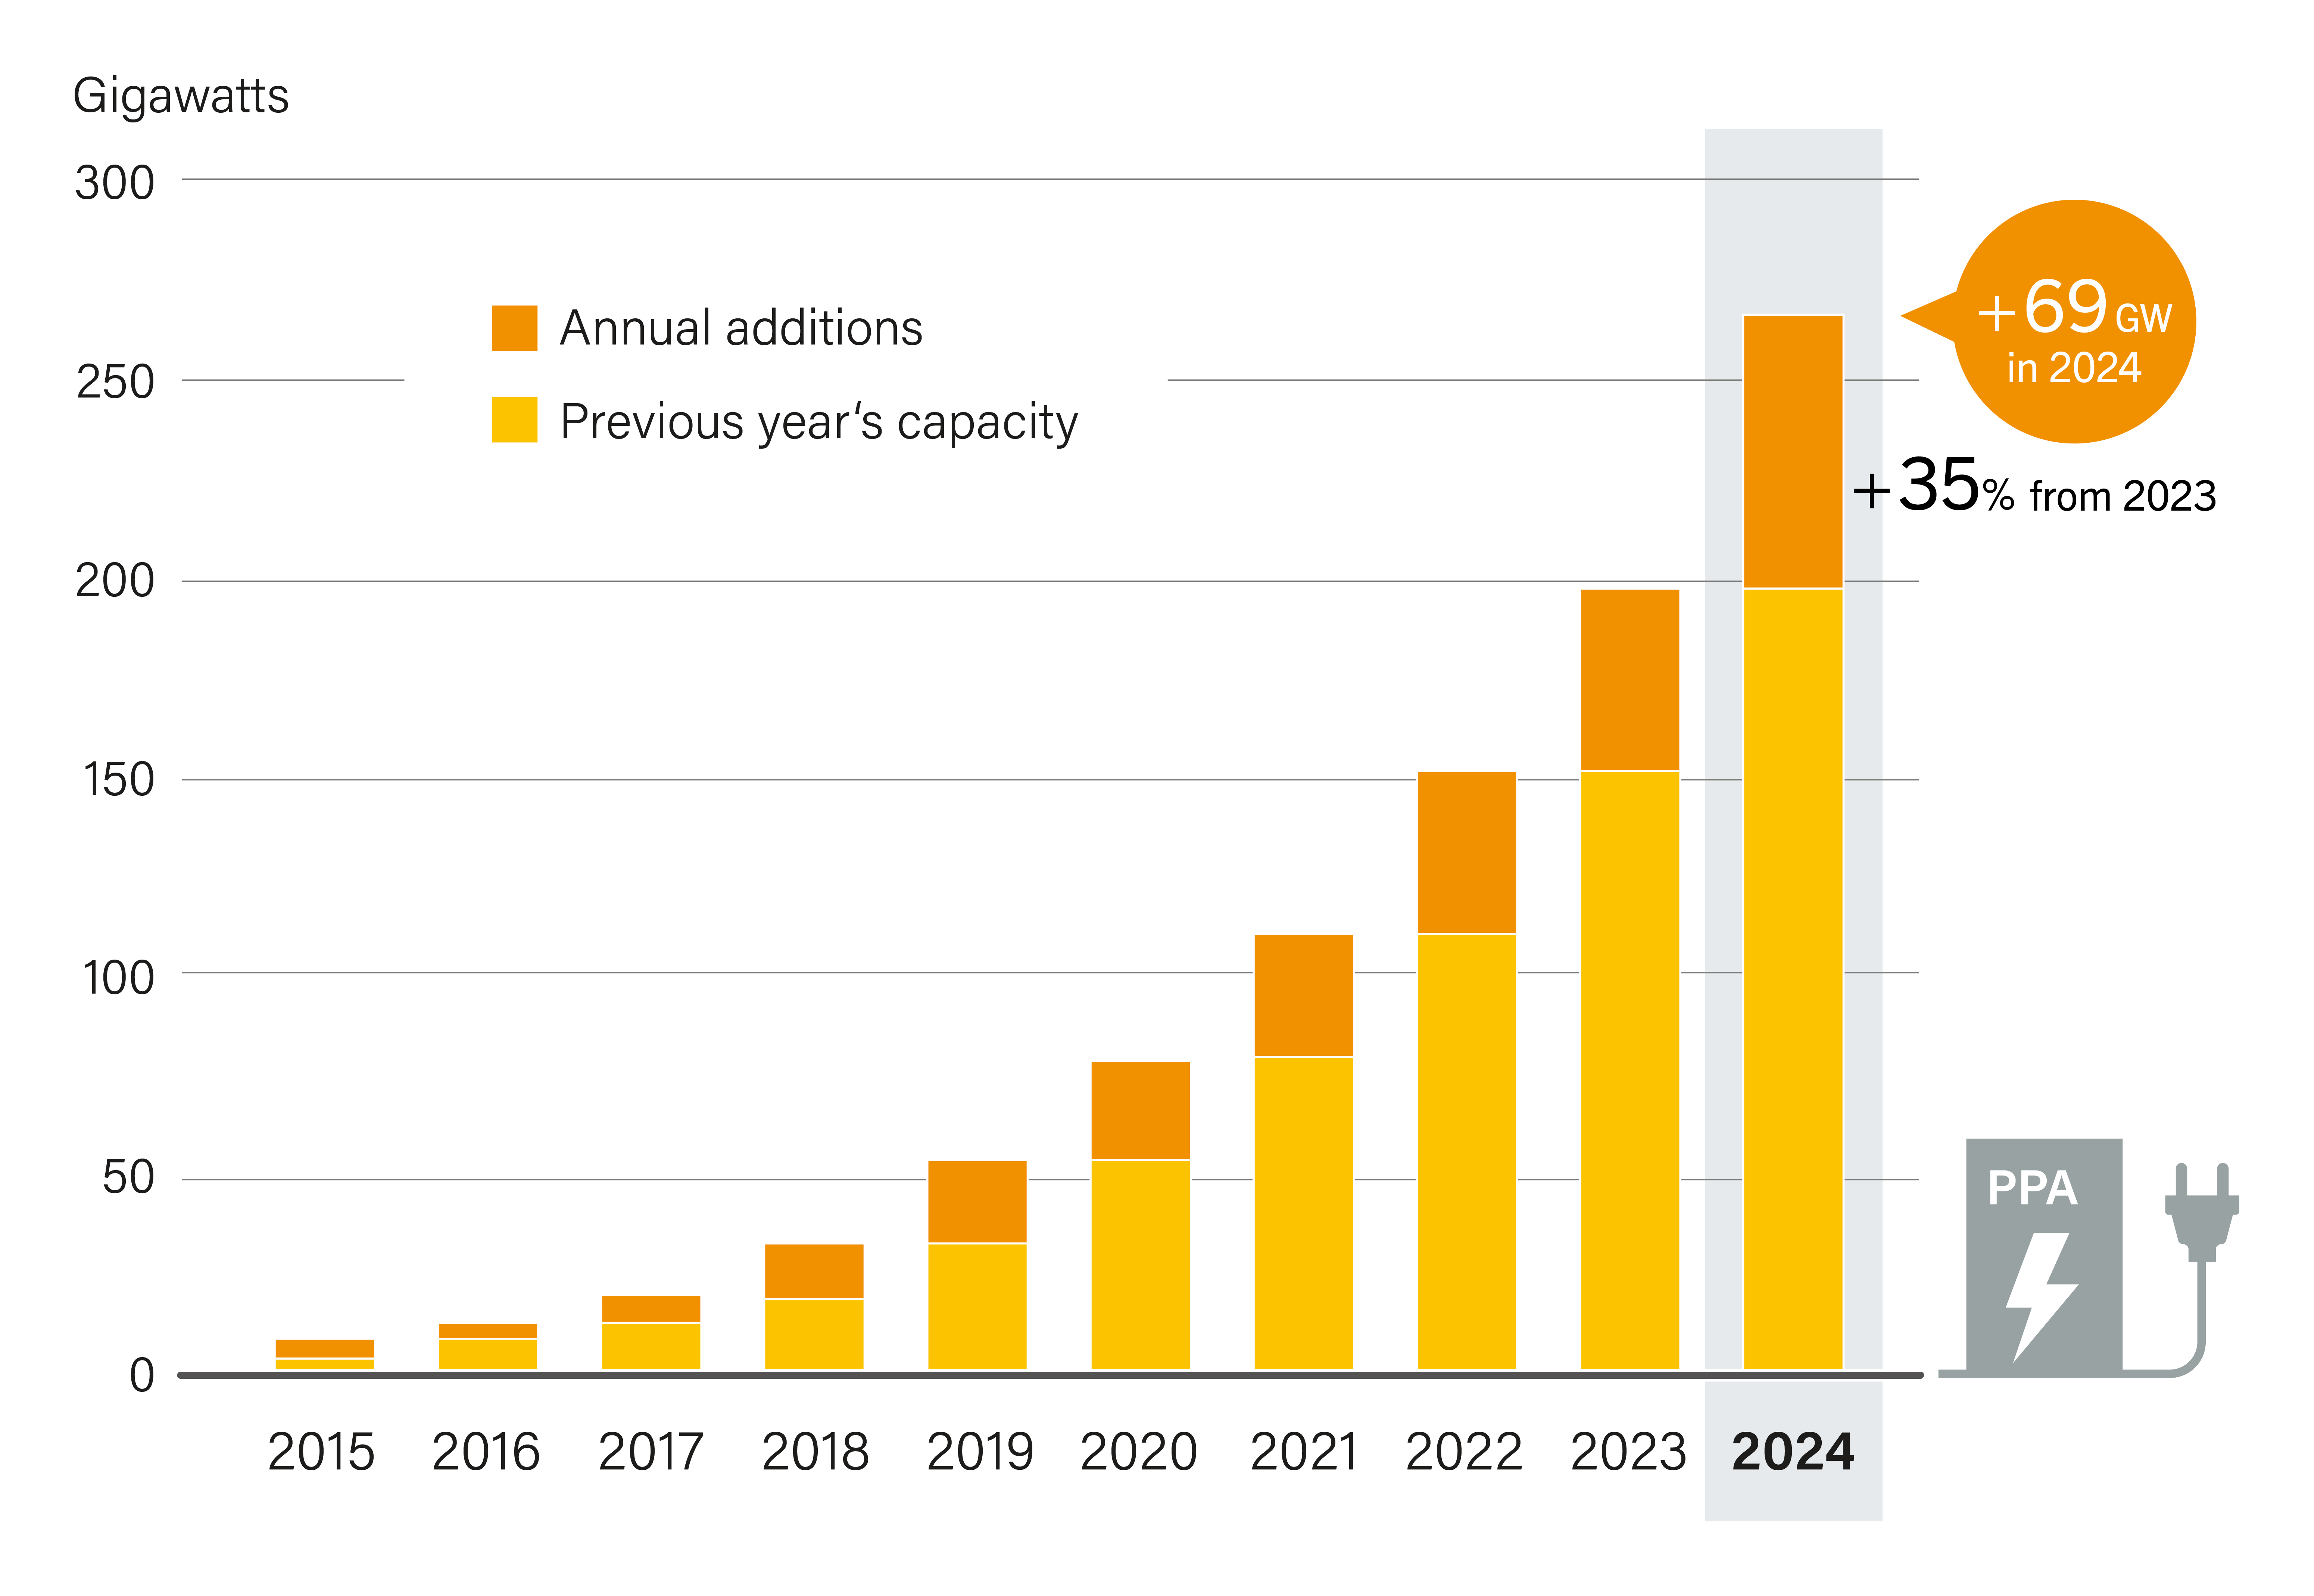
Sidebar 7. Power Purchase Agreements (PPAs)
In 2024, the global volume of renewable power capacity contracted through corporate power purchase agreements (PPAs) increased an estimated 35%, representing around 69 GW of new capacity. (See Figure 30).

Data centre operators accounted for the majority of these PPAs, largely through direct third-party contracts. The biggest US-based information technology companies – Amazon, Google, Microsoft and Meta – collectively signed 15 GW worth of PPAs across Asia-Pacific, Europe, and North America; this excludes a 10 GW framework agreement that Microsoft signed with Brookfield, a large global investor in renewable power projects. Also in 2024, the manufacturing sector signed around 9 GW of PPAs, followed by the services sector with around 6 GW. The mining sector was also an important PPA off-taker. Solar PV and wind power technologies were the most contracted renewable energy sources for PPAs in 2024.
The largest increase in corporate PPAs was in the United States, which added 19 GW. Some suppliers reported record growth in long-term US renewable energy contracts. However, technology companies in the United States have also entered into nuclear PPAs. Contracts that include nuclear energy represented 14% of companies' total contracted capacity between February 2024 and May 2025.
In Europe, solar PV and wind power accounted for around 80% of the newly contracted PPA capacity, with some estimates totalling about 19 GW. Corporate PPAs made up 87% of the European market by deal count and 83% by contracted volume, with 157 corporate actors signing their first PPAs in 2024. The IT sector led in contracted volumes (3.8 GW), while capital goods i recorded the highest number of deals. Consumer goods accounted for 1.46 GW of first-time buyer volumes. The most contracted technology was solar PV, followed by wind power, mainly onshore.
In the Asia-Pacific region, renewable PPAs were supported by policies and regulations in several countries. Examples include Malaysia's Corporate Renewable Energy Supply Scheme, Thailand's Utility Green Tariff, and Viet Nam's Direct Power Purchase Agreement regulation. Corporate PPAs also increased in Japan, with the dynamic market rising to a cumulative total of nearly 500 deals by the end of 2024, up from 226 a year earlier. In China, where a “green electricity” ii trading pilot programme was launched in 2021, official rules were issued in 2024 to regulate the attribution of green electricity certificates. Merck China signed a 10-year PPA with the public utility China Resources Public, through green electricity certificates.
Africa saw progress in both utility and corporate renewable PPAs. Burkina Faso, Côte d'Ivoire and South Africa all advanced solar procurement through 20- to 25-year PPAs. The utility actors Eskom and SONABEL led multiple agreements, and corporate contracts included the global mining and commodities company Glencore.
In South America, renewable energy procurement through PPAs was driven by industry demand. In Chile, CODELCO pursued 100% clean energy via long-term solar contracts, and the Spanish energy producer Grenergy secured a 12-year PPA for grid-supply. Brazil's green hydrogen projects relied on renewable PPAs for electricity supply.
Virtual power purchase agreements (VPPAs) have emerged in corporate renewable energy procurement. VPPAs are financial contracts where the buyer agrees to purchase renewable energy at a predetermined price, without taking physical delivery of the electricity. Instead, the electricity is sold into the wholesale market, and the buyer receives renewable energy certificates (RECs), allowing companies to support renewable projects while managing energy price volatility. In 2024, the global REC market reached an estimated USD 16.2 billion, up from USD 13.7 billion in 2023.
i Capital goods are the buildings, machines, and equipment that are used to produce products or provide services. Consumer goods are defined as products that people buy for their own use. (Definitions of capital and consumer goods from the Cambridge Business English Dictionary, Cambridge University Press)
ii Under Chinese rules for medium- and long-term electricity transactions, the definition of green electricity includes wind power, solar power, conventional hydropower, biomass power, geothermal power and ocean power.
Policy Developments
Overall, the slow rates of renewable energy adoption across end-use sectors reflect a lack of co-ordinated, cross-sectoral policies created from a demand perspective. Of the 69 countries that had national policies specifically targeting one or more end-use sectors as of 2024, only 5 countries had policies iii targeting all four sectors. 64 (See Figure 31.) The majority of countries targeted the transport and buildings sectors, whereas the agriculture and industry sectors were less represented in national renewable energy policies. 65
FIGURE 31 Countries with National Renewable Energy Policies for End-Use Sectors, as of 2024
Regulations such as mandates for biofuel blends in the transport sector and for renewable energy integration in buildings remained the main mechanisms for increasing the adoption of renewables, together with financial incentives for installing on-site renewable generation systems.
In the agriculture sector, most new policies supporting renewables in 2024 focused on the adoption of solar PV technologies for farming activities. 66 This included incentivising the installation of solar irrigation systems, with several countries incorporating deployment targets for such systems in their Nationally Determined Contributions (NDCs) towards reducing greenhouse gas emissions under the Paris Agreement.
Incentives and regulations also promoted the uptake of agrivoltaics and, to a lesser extent, anaerobic digesters for biogas production. 67 Recent examples include the USD 1.84 billion (EUR 1.7 billion) budget allocated in Italy to the deployment of agrivoltaics, subsidies in Morocco for the purchase of solar pumps, and the United Kingdom Farming Investment Fund supporting the acquisition of new equipment for farmers, which includes solar PV to increase farm productivity. 68 EU countries such as Romania and Portugal, in transposing the region's Common Agricultural Policy (CAP), have proposed subsidies for the installation of on-farm solar and wind generation. 69

In the buildings sector, fiscal and financial incentives such as subsidies, rebates and tax exemptions have dominated the policy landscape, to encourage installations of rooftop solar PV and solar thermal systems, as well as the use of heat pumps to replace gas boilers. Regulations also have gained traction, including bans on fossil fuel boilers; building codes that incorporate mandatory shares of renewables and obligations to integrate solar PV or solar thermal systems in new buildings; and requirements to integrate renewable energy into district heating networks. 70 Austria's new Renewable Heat Act extended the existing ban on central heating systems based on fossil oil and coal to cover all fossil fuel-based heating systems in new buildings, as a way to advance decarbonisation of the building sector by 2040. 71 Similar bans were enacted in the Czech Republic, Scotland and Slovenia. 72
Reducing energy use in buildings is also in policymakers focus, given the sector significant contribution to TFEC. 73 In 2024, governments representing more than 70% of the world's energy demand implemented or updated national energy efficiency policies, including for buildings. 74 The EU reinforced its Energy Efficiency Directive by setting targets for a 4% annual efficiency improvement and an 11.7% annual decline in energy use by 2030. 75 The EU's revised Energy Performance of Buildings Directive requires new buildings to be solar-ready and targets cutting residential energy use 16% by 2030 and up to 22% by 2035. 76
The affordability of building renovations and efficient equipment have attracted policy attention as well. 77 However, as of 2024, energy efficiency requirements did not cover nearly half of the global newly built surface. 78
With the surge in energy consumption from cooling, countries have increasingly focused on developing national cooling strategies. 79 (See Sidebar 8.)
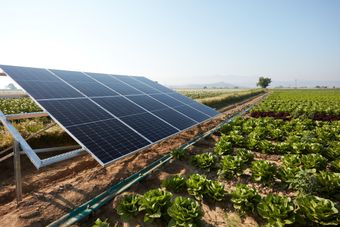
In the agriculture sector, most new policies supporting renewables in 2024 focused on the adoption of solar PV technologies for farming activities.
Sidebar 8. National Cooling Action Plans
Driven by global warming, population growth, urbanisation, and rising incomes, demand for cooling has more than tripled since 1990 and now accounts for over 10% of global electricity use. Around 2 billion air conditioners are in operation worldwide, and an estimated 14 billion cooling devices will be needed by 2050. Unchecked growth threatens to raise emissions, strain electricity grids, trigger outages and worsen air pollution.
Access to cooling remains deeply unequal, even as the risks of extreme heat grow worldwide. As of 2021, only 15% of the 3.5 billion people living in hot climates owned an air conditioner, with even lower rates in Sub-Saharan Africa and South Asia. Yet heat-related deaths are rising in all regions, driven not only by high temperatures but also by sudden extremes, especially early in the warm season. Among people aged 65 and older, heat-related mortality rose by 61% between 2002–2004 and 2019–2021, exceeding 300,000 globally. Although access to effective cooling already averts an estimated 190,000 deaths each year, its benefits remain concentrated in higher-income households and regions.
To respond, many governments have adopted National Cooling Action Plans (NCAPs), strategies that integrate efficiency, refrigerant transition, building design and equitable access. As of 2024, at least 23 countries had adopted NCAPs or similar strategies (See Figure 32), often supported by the United Nations Development Programme and the Clean Cooling Collaborative.
These plans typically include phase-down targets for hydrofluorocarbons (HFCs) – potent greenhouse gases commonly used in cooling equipment – alongside minimum energy performance standards (MEPS), appliance labelling, incentives and building-level measures. Some NCAPs are aligned with countries' Nationally Determined Contributions (NDCs) under the Paris Agreement and the Kigali Amendment to the Montreal Protocol, a global agreement to gradually reduce the production and use of HFCs.
FIGURE 32 Countries with Cooling Action Plans, as of 2024
NCAPs share core elements – efficient appliances, sustainable refrigerants and passive cooling – and are increasingly incorporating renewable energy and behavioural change. As national priorities vary, some NCAPs target grid constraints or climate risks (e.g., in small island developing states), while others focus on stakeholder engagement or policy coherence.
Equity-focused NCAPs also address affordability and access. Measures include support for public institutions, community cooling hubs and inclusive financing.
Beyond buildings, there is major potential to expand renewable-powered cooling in the cold chain sector – the temperature-controlled supply system for perishable goods like food, medicines and vaccines. Technologies such as solar PV-powered cooling and solar thermal-driven sorption cooling systems and geothermal solutions are gaining ground. Paired with thermal energy storage, ice storage, and thermally activated systems, these approaches enable load shifting, increase resilience, reduce emissions, ease grid pressure and help mitigate urban heat.
Scalable solutions include district cooling, super-efficient solar-powered fans, low-tech coolers and solar home systems. Off-grid renewables for health facilities provide reliable electricity in underserved areas, strengthening public health and infrastructure.
Cooling is no longer a marginal issue – it is central to adaptation, health and energy security. When well-implemented, NCAPs can cut emissions, save lives and strengthen energy systems. Global initiatives are scaling support, such as the Global Cooling Pledge, which aims to cut cooling-related emissions at least 68% by 2050 compared to 2022, and the Cooling Facility, a World Bank and Green Climate Fund initiative providing financing of USD 157 million.
As technologies evolve and ambition rises, countries that prioritise equitable, sustainable cooling will be better positioned to protect people, reinforce systems, and meet long-term climate and development goals.
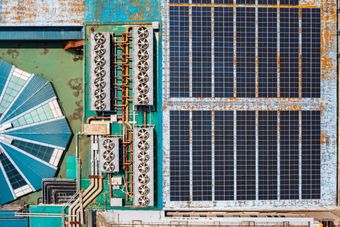
Policies focused on integrating renewables in the industry sector remain scarce. Mechanisms for decarbonising heavy industries such as cement, iron and steel include carbon pricing and emission trading schemes, as well as financial support through tax incentives or contracts for difference. 80 In 2024, China announced that its national emission trading scheme would apply to heavy industries (although the high volume of initial free allowances has triggered criticism), and Germany launched the first funding programme for carbon contracts for difference, with a budget of USD 4.2 billion (EUR 4 billion). 81 The EU's carbon border adjustment mechanism (CBAM), in its 2023-2025 transitional phase, requires producers of goods imported to the region to report direct and indirect emissions from production processes, potentially fostering greater renewable energy use. 82
Industrial decarbonisation strategies enacted in recent years include the EU's Net Zero Industry Act, adopted in June 2024, and the US Inflation Reduction Act, which provide incentives for low-carbon technologies in the sector and can support the adoption of renewables. 83 In 2023, Japan required that large energy consumers submit plans for decarbonisation, including for renewable energy use. 84
Significant focus has been given to green hydrogen projects to decarbonise the industry sector. 85 Meanwhile, in Scandinavian countries, carbon taxes have been seen as an important driver for industries to adopt bioenergy-based heat instead of fossil fuels. 86
In the transport sector, jurisdictions such as Australia, Brazil, the Dominican Republic, the EU, the Republic of Korea and the United States have established standards for fuel efficiency and emission reduction as well as mandates for renewable energy shares (for example, for biofuels for the road transport or minimum blends of sustainable aviation fuels). 87 Financial support for electric vehicle adoption remained the most prominent policy in transport, with an emphasis on local manufacturing, infrastructure development, incentives for consumers and industries, and programmes to electrify public fleets and public transport. 88 In the EU, policy attention was given to carbon dioxide emission standards and targets. 89 In the maritime sector, a range of policies have been implemented that focus on advancing green shipping corridors to reduce emissions. 90
i Renewables-based district heating supplies 3.4% of the renewable heat in the industry sector. See endnote 9.
ii In low-income countries, the main energy source in the agriculture sector is human and animal work. The downstream activities of the food processing chain are not included in the sectoral calculations. See endnote 24.
iii Policies in this figure include national regulations and fiscal or financial incentives for the integration of renewables in end-use sectors. They do not include sub-national policies or bans on fossil fuel boilers unless these specifically target the integration of renewables. Incentives for the acquisition of enabling technologies such as heat pumps or electric vehicles are not included.
Challenges and Opportunities
Challenges to Renewables in 2024
Climate ambition weakened as several governments rolled back previous commitments, while trade restrictions and unpredictable regulatory environments added uncertainty across renewable energy markets.
Fossil fuel subsidies continued to distort energy markets, diverting public resources and disadvantaging renewables.
Tight financial conditions, including high interest rates, inflation, currency volatility, and debt burdens, made capital harder to access, especially in developing economies. Increasing running costs and uncertain returns resulted in narrow market margins, further undermining investor confidence.
Project development was slowed by structural barriers, including permitting delays, misinformation, and, in some cases, public resistance. Skilled labour shortages and lack of grid capacity and flexibility further limited deployment capacity.
Energy demand rose, driven by an increase in demand for cooling, growing digital infrastructure and expanding electric vehicle fleets. At the same time, energy access remains a major challenge, with millions of people still lacking basic electricity services, especially in sub-Saharan Africa.
The uptake of renewables is concentrated in a limited set of technologies – particularly solar PV and wind power – and in specific regions, leaving many parts of the world underserved.
Opportunities for 2025 and Beyond
As governments seek to enhance energy security and resilience, renewables are becoming central to national energy strategies. New commitments at the national and international levels reflect growing recognition of renewable energy as essential for both climate mitigation and adaptation.
Distributed and off-grid solar PV systems are expanding rapidly, particularly in emerging economies. This reflects growing demand from the public and demonstrates the viability of decentralised solutions.
The rise in power purchase agreements, particularly among tech giants and industrial actors, underscores increasing confidence in renewables as a reliable and cost-effective energy source.
Sectoral integration and electrification in housing, mobility, and industry are creating new opportunities for renewable energy adoption, as the transition becomes embedded in broader economic strategies.
Digitalisation and artificial intelligence are further enhancing grid operations, improving system planning, and enabling smarter, more adaptive energy systems.
Annex
Downloads & Info
PDFs
- GSR_2025_Factsheet_Demand_Agriculture (PDF, 13.5 MB)
- GSR_2025_Factsheet_Demand_Buildings (PDF, 16.6 MB)
- GSR_2025_Factsheet_Demand_Industry (PDF, 13.6 MB)
- GSR_2025_Factsheet_Demand_Transport (PDF, 12.5 MB)
- GSR_2025_Global_Overview (PDF, 13.0 MB)
- GSR_2025_Factsheet_Supply_Bioenergy (PDF, 9.6 MB)
- GSR_2025_Factsheet_Supply_CSP (PDF, 5.3 MB)
- GSR_2025_Factsheet_Supply_Geothermal (PDF, 6.6 MB)
- GSR_2025_Factsheet_Supply_Hydropower (PDF, 5.1 MB)
- GSR_2025_Factsheet_Supply_STH (PDF, 4.6 MB)
- GSR_2025_Factsheet_Supply_SolarPV (PDF, 9.4 MB)
- GSR_2025_Factsheet_Supply_Wind (PDF, 8.3 MB)
Presentations
Figures / Maps


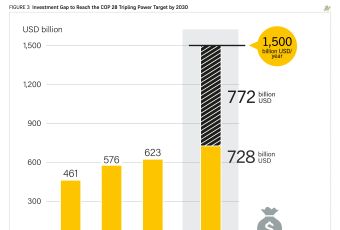

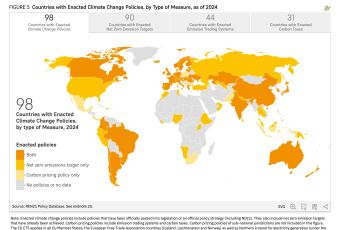
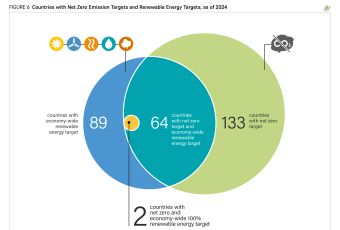
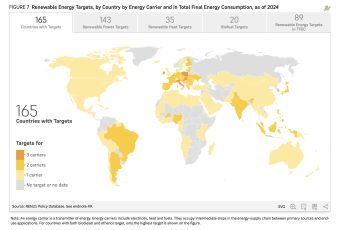
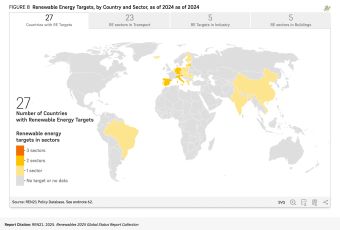
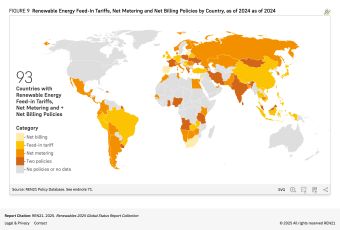
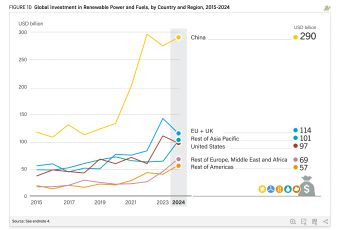

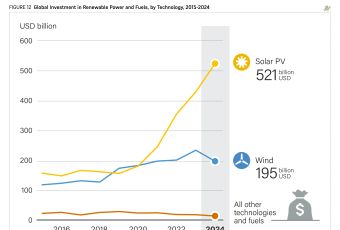

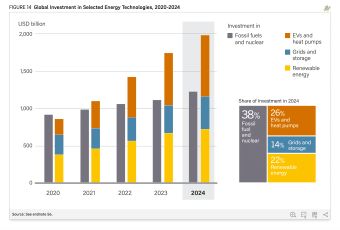


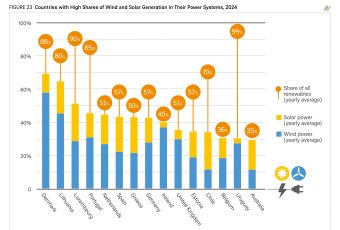

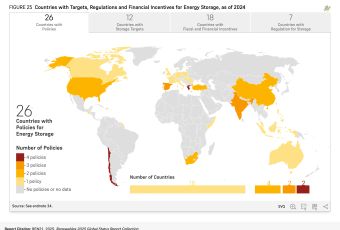

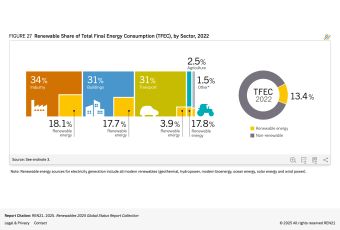
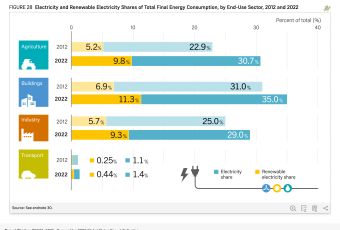


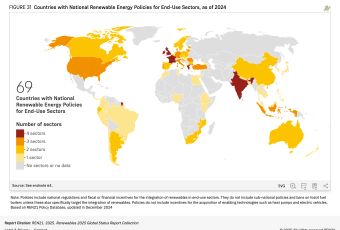


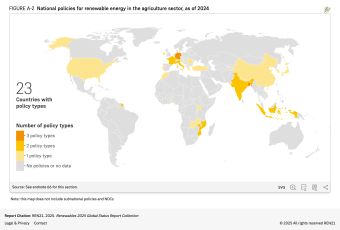
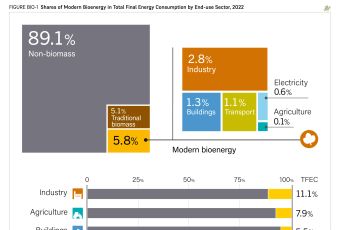
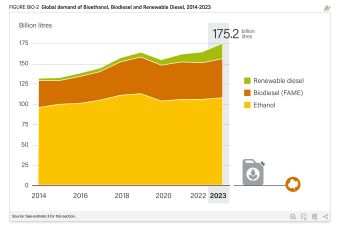
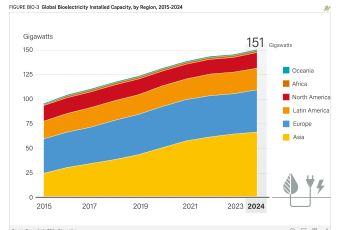


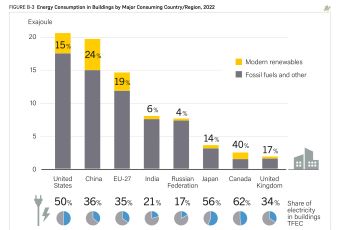


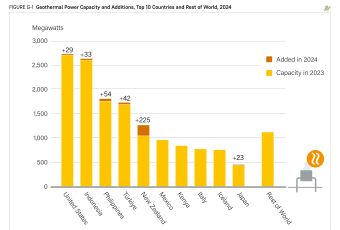
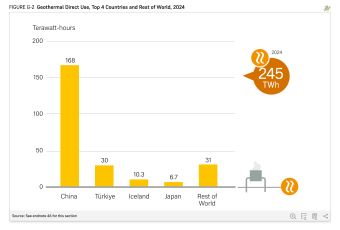
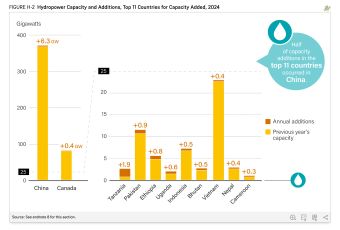
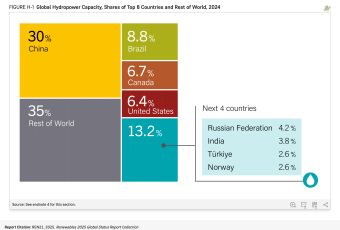

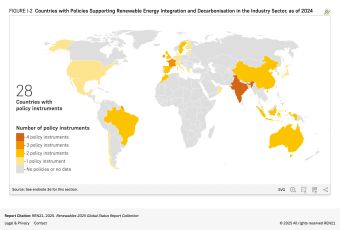
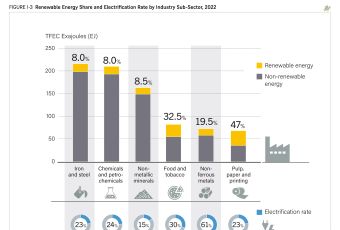
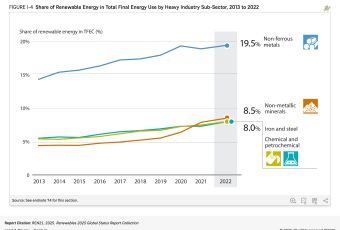
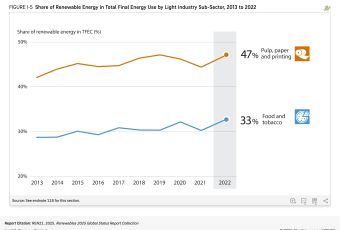
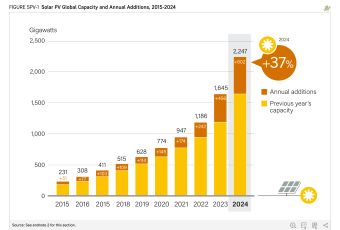


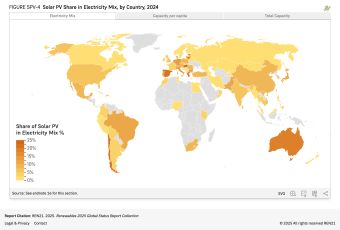
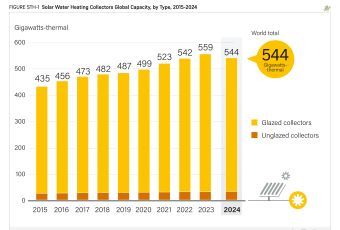
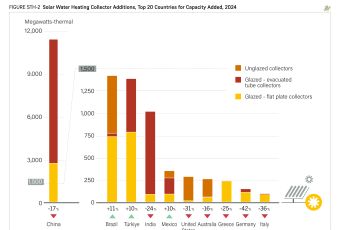


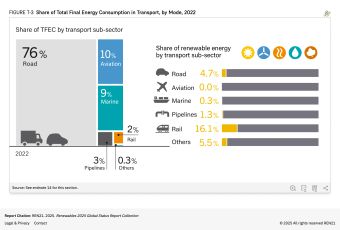


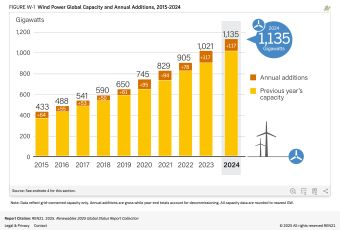

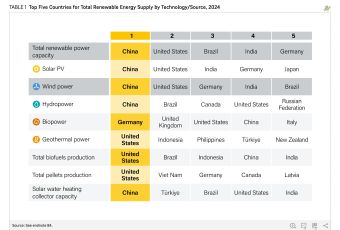

Datapacks
- GSR_2025_DEMAND_datapack (ZIP, 6.1 MB)
- GSR_2025_Figure_A1 (XLSX, 0.6 MB)
- GSR_2025_Figure_A2 (XLSX, 0.4 MB)
- GSR_2025_Figure_B1 (XLSX, 0.8 MB)
- GSR_2025_Figure_B2 (XLSX, 0.1 MB)
- GSR_2025_Figure_B3 (XLSX, 0.1 MB)
- GSR_2025_Figure_B4 (XLSX, 1.3 MB)
- GSR_2025_Figure_I1 (XLSX, 0.1 MB)
- GSR_2025_Figure_I2 (XLSX, 0.8 MB)
- GSR_2025_Figure_I3 (XLSX, 0.8 MB)
- GSR_2025_Figure_I4 (XLSX, 0.9 MB)
- GSR_2025_Figure_I5 (XLSX, 0.7 MB)
- GSR_2025_Figure_T1 (XLSX, 0.0 MB)
- GSR_2025_Figure_T2 (XLSX, 0.0 MB)
- GSR_2025_Figure_T3 (XLSX, 0.0 MB)
- GSR_2025_Figure_T4 (XLSX, 0.0 MB)
- GSR_2025_Figure_T5 (XLSX, 0.1 MB)
- GSR_2025_GO_Figure_1 (XLSX, 0.1 MB)
- GSR_2025_GO_Figure_10 (XLSX, 0.6 MB)
- GSR_2025_GO_Figure_11 (XLSX, 0.3 MB)
- GSR_2025_GO_Figure_12 (XLSX, 0.5 MB)
- GSR_2025_GO_Figure_13 (XLSX, 0.3 MB)
- GSR_2025_GO_Figure_14 (XLSX, 0.5 MB)
- GSR_2025_GO_Figure_15 (XLSX, 0.4 MB)
- GSR_2025_GO_Figure_16 (XLSX, 0.6 MB)
- GSR_2025_GO_Figure_17 (XLSX, 1.0 MB)
- GSR_2025_GO_Figure_18 (XLSX, 0.4 MB)
- GSR_2025_GO_Figure_19 (XLSX, 0.9 MB)
- GSR_2025_GO_Figure_2 (XLSX, 0.3 MB)
- GSR_2025_GO_Figure_20 (XLSX, 0.8 MB)
- GSR_2025_GO_Figure_21 (XLSX, 0.4 MB)
- GSR_2025_GO_Figure_22 (XLSX, 0.5 MB)
- GSR_2025_GO_Figure_23 (XLSX, 0.8 MB)
- GSR_2025_GO_Figure_24 (XLSX, 0.3 MB)
- GSR_2025_GO_Figure_25 (XLSX, 1.6 MB)
- GSR_2025_GO_Figure_26 (XLSX, 1.3 MB)
- GSR_2025_GO_Figure_27 (XLSX, 0.4 MB)
- GSR_2025_GO_Figure_28 (XLSX, 0.5 MB)
- GSR_2025_GO_Figure_29 (XLSX, 0.4 MB)
- GSR_2025_GO_Figure_3 (XLSX, 0.1 MB)
- GSR_2025_GO_Figure_30 (XLSX, 0.4 MB)
- GSR_2025_GO_Figure_31 (XLSX, 1.5 MB)
- GSR_2025_GO_Figure_32 (XLSX, 1.2 MB)
- GSR_2025_GO_Figure_4 (XLSX, 0.5 MB)
- GSR_2025_GO_Figure_5 (XLSX, 1.5 MB)
- GSR_2025_GO_Figure_6 (XLSX, 0.2 MB)
- GSR_2025_GO_Figure_7 (XLSX, 0.4 MB)
- GSR_2025_GO_Figure_8 (XLSX, 1.3 MB)
- GSR_2025_GO_Figure_9 (XLSX, 0.6 MB)
- GSR_2025_GO_Table_1 (XLSX, 0.1 MB)
- GSR_2025_GO_Table_2 (XLSX, 0.1 MB)
- GSR_2025_GO_datapack (XLSX, 18.5 MB)
- GSR_2025_Figure_BIO1 (XLSX, 0.6 MB)
- GSR_2025_Figure_BIO2 (XLSX, 0.5 MB)
- GSR_2025_Figure_BIO3 (XLSX, 0.5 MB)
- GSR_2025_Figure_BIO4 (XLSX, 0.5 MB)
- GSR_2025_Figure_CSP1 (XLSX, 0.5 MB)
- GSR_2025_Figure_G1 (XLSX, 0.3 MB)
- GSR_2025_Figure_G2 (XLSX, 0.4 MB)
- GSR_2025_Figure_H1 (XLSX, 0.1 MB)
- GSR_2025_Figure_H2 (XLSX, 0.2 MB)
- GSR_2025_Figure_SPV1 (XLSX, 0.5 MB)
- GSR_2025_Figure_SPV2 (XLSX, 0.6 MB)
- GSR_2025_Figure_SPV3 (XLSX, 0.6 MB)
- GSR_2025_Figure_SPV4 (XLSX, 2.3 MB)
- GSR_2025_Figure_STH1 (XLSX, 0.2 MB)
- GSR_2025_Figure_STH2 (XLSX, 0.3 MB)
- GSR_2025_SUPPLY_datapack (ZIP, 6.2 MB)
Data collection and validation
REN21 has developed a unique renewable energy reporting culture, allowing it to become recognised as a neutral data and knowledge broker that provides credible and widely accepted information. Transparency is at the heart of the REN21 data and reporting culture, and the following text explains some of the GSR's key processes for data collection and validation.
DATA COLLECTION
Production of REN21's GSR is a continuous process occurring on an annual basis. The data collection process begins following the launch of the previous year's report with an Expression of Interest form to mobilise REN21's GSR contributors. During this time, the GSR team also prepares the questionnaires that will be filled in by contributors. The questionnaires are updated each year with emerging and relevant topics as identified by the REN21 Secretariat. The data collection process involves the following elements:
-
Open data collection. In the open data collection questionnaire, contributors from around the world submit data on renewable energy in their respective countries or countries of interest. This covers information on annual developments in renewable energy technologies, market trends, policies and local perspectives. The questionnaire also collects data related to energy access from respondents – with a focus on developing and emerging countries – on the status of electrification and clean cooking as well as policies and programmes for energy access and markets for distributed renewables. Each data point is provided with a source and verified independently by the REN21 GSR team. Data collection with the country questionnaire typically begins in October.
-
Regional contributors. For some world regions, REN21 appoints one principal data contributor to provide specific renewable energy data across different sectors and to share an overview of general trends and developments of renewables in the specific region.
-
Peer review. To further collect data and project examples and to ensure that significant developments have not been overlooked, GSR contributors and reviewers participate in an open peer review process that takes place twice during each report cycle. For GSR 2023, the peer review round for theRenewables in Energy Demand module occurred in November 2022 for outlines and in January 2023 for the full draft. The peer review rounds for the Renewables in Energy Supply, the Renewable Energy Systems and Infrastructure, and the Renewables for Economic and Social Value Creation modules took place in December 2022 for outlines and was scheduled to occur in April 2023 for the full draft as well as for the Global Overview. Peer review is open to all interested experts.
-
Expert interviews. REN21's global community consists of a wide range of professionals who provide their expert input on renewable energy trends in the target year through interviews and personal communication with the REN21 GSR team and chapter authors. The vast majority of the information is backed up by primary sources.
-
Desk research. To fill in remaining gaps in the GSR and to pursue new topics, the REN21 GSR team and chapter authors conduct extensive desk research. Topics of research vary widely between GSR years and depend on emerging topics, important trends and annual availability of formal or informal data in the target sector.
-
Policy database (national, sub-national, cities). The REN21 GSR team compiles data on policy-specific indicators, especially targets and policies. This is collected from regional contributors and through desk research. For the city-level data, this builds also on existing consolidated datasets at the global or regional level.
-
Data-sharing agreements. REN21 holds several data-sharing agreements with some of the largest and most reliable data providers/aggregators in the energy sector. These formal data are used exclusively in some cases or, in others, form the foundation of calculations and estimations presented in the GSR.
DATA VALIDATION
REN21 ensures the accuracy and reliability of its reports by conducting data validation and fact checking as a continuous process. Beginning during the first submission of the country questionnaires, data are continually verified up through the design period and until the final report is published. All data provided by contributors, whether written or verbal, are validated by primary sources, which are published alongside the full report.
Abbreviations
- AfDB
- African Development Bank
- AMP
- Africa Minigrids Program
- ASEAN
- Association of Southeast Asian Nations
- AUD
- Australian dollar
- BCM
- Billion cubic metres
- CAD
- Canadian dollar
- CAPEX
- Capital expenditure
- CCA
- Community choice aggregation
- CHP
- Combined heat and power
- CNY
- Chinese yuan
- CNG
- Compressed natural gas
- CO2
- Carbon dioxides
- COP
- Conference of the Parties
- CORSIA
- Carbon Offsetting and Reduction Scheme for International Aviation
- CSP
- Concentrating solar-thermal power
- DRE
- Decentralised renewable energy
- DREA
- Distributed renewables for energy access
- DRI
- Direct-reduced iron
- EaaS
- Energy-as-a-Service
- EC
- European Commission
- ECOWAS
- Economic Community of West African States
- EGS
- Enhanced geothermal systems
- EJ
- Exajoule
- EMT
- Madrid Municipal Transport Company
- EPBD
- Energy Performance in Buildings Directive
- ESCO
- Energy service company
- ESG
- Environmental, Social and Governance
- ETS
- Emission trading system
- EU
- European Union (EU-27)
- EUR
- Euro
- EV
- Electric vehicle
- FAME
- Fatty acid methyl esters
- FIT
- Feed-in tariff
- FSD
- Financing Steel Decarbonisation
- G20
- Group of Twenty
- GBP
- British pound
- GCF
- Green Climate Fund
- GDP
- Gross domestic product
- GEIPP
- Global Eco-Industrial Parks Programme
- GERD
- Grand Ethiopian Renaissance Dam
- GSR
- Global Status Report
- GW/GWh
- Gigawatt/gigawatt-hour
- GWth
- Gigawatt-thermal
- HEFA
- Hydrotreated esters and fatty acids
- HJT
- Heterojunction cell technology
- HVDC
- High-voltage direct current
- HVO
- Hydrotreated vegetable oil
- ICE
- Internal combustion engine
- IEA
- International Energy Agency
- IPCEI
- Important Project of Common European Interest
- IRA
- Inflation Reduction Act
- ktoe
- Kilotonne of oil equivalent
- kW/kWh
- Kilowatt/kilowatt-hour
- Wth
- kilowatt-thermal
- LCOE
- Levelised cost of energy (or electricity)
- LDC
- Least developed country
- LPG
- Liquefied petroleum gas
- m2
- Square metre
- MJ
- Megajoule
- MoU
- Memorandum of Understanding
- Mt
- Megatonne
- Mtoe
- Megatonne of oil equivalent
- MW/MWh
- Megawatt/megawatt-hour
- MWth
- Megawatt-thermal
- MXN
- Mexican peso
- NAMA
- Nationally Appropriate Mitigation Action
- NCAP
- National Cooling Action Plan
- NDC
- Nationally Determined Contribution
- NREL
- US National Renewable Energy Laboratory
- O&M
- Operations and maintenance
- ÖBB
- Austrian Federal Railway
- OECD
- Organisation for Economic Co-operation and Development
- OTEC
- Ocean thermal energy conversion
- PAYGo
- Pay-as-you-go
- PJ
- Petajoule
- PM 2.5
- Particulate matter 2.5
- PPA
- Power purchase agreement
- PTC
- Production Tax Credit
- PV
- Photovoltaic
- PVT
- Photovoltaic-thermal hybrid solar collector
- R&D
- Research and development
- RED
- EU Renewable Energy Directive
- RES
- Renewable energy sources
- RPS
- Renewable portfolio standard
- SAF
- Sustainable aviation fuel
- SDG
- Sustainable Development Goal
- SHIP
- Solar heat for industrial processes
- TCFD
- Task Force on Climate-Related Financial Disclosures
- TES
- Thermal energy storage
- TFEC
- Total final energy consumption
- TW/TWh
- Terawatt/Terawatt hour
- UK
- United Kingdom
- UN
- United Nations
- UNIDO
- United Nations Industrial Development Organization
- US
- United States
- USD
- United States dollar
- VAT
- Value-added tax
- V2G
- Vehicle-to-grid
- VIPV
- Vehicle-integrated photovoltaic
- VPP
- Virtual power plant
Glossary
- Absorption chillers.
- Chillers that use heat energy from any source (solar, biomass, waste heat, etc.) to drive air conditioning or refrigeration systems. The heat source replaces the electricpower consumption of a mechanical compressor. Absorption chillers differ from conventional (vapour compression) cooling systems in two ways: 1) the absorption process is thermochemical in nature rather than mechanical, and 2) the substancethat is circulated as a refrigerant is water rather than chlorofluorocarbons (CFCs) or hydrochlorofluorocarbons (HCFCs), also called Freon. The chillers generally are supplied with district heat, waste heat or heat from co-generation, andthey can operate with heat from geothermal, solar or biomass resources.
- Adsorption chillers.
- Chillers that use heat energy from any source to drive air conditioning or refrigeration systems. They differ from absorption chillers in that the adsorption process is basedon the interaction between gases and solids. A solid material in the chiller's adsorption chamber releases refrigerant vapour when heated; subsequently, the vapour is cooled and liquefied, providing a cooling effect at the evaporator byabsorbing external heat and turning back into a vapour, which is then re-adsorbed into the solid.
- Agrivoltaic.
- Simultaneous use of an agricultural land for both growing crops and a photovoltaic (PV) solar energy system. With the agrivoltaics solar energy system, certain types of agriculturalproducts can be grown while generating electricity on agricultural lands and under the construction where solar panels are placed.
- Auction.
- See Tendering.
- Bagasse.
- The fibrous matter that remains after extraction of sugar from sugar cane.
- Behind-the-meter system.
- Any power generation capacity, storage or demand management on the customer side of the interface with the distribution grid (i.e., the meter). (Also see Front-of-metersystem.)
- Biodiesel.
- A fuel produced from oilseed crops such as soy, rapeseed (canola) and palm oil, and from other oil sources such as waste cooking oil and animal fats. Biodiesel is used in dieselengines installed in cars, trucks, buses and other vehicles, as well as in stationary heat and power applications. Most biodiesel is made by chemically treating vegetable oils and fats (such as palm, soy and canola oils, and some animal fats)to produce fatty acid methyl esters (FAME). (Also see Hydrotreated vegetable oil (HVO) and hydrotreated esters and fatty acids (HEFA).)
- Bioeconomy (or bio-based economy).
- Economic activity related to the invention, development, production and use of biomass resources for the production of food, fuel, energy, chemicals andmaterials.
- Bioenergy.
- Energy derived from any form of biomass (solid, liquid or gaseous) for heat, power and transport. (Also see Biofuel.)
- Biofuel.
- A liquid or gaseous fuel derived from biomass, primarily ethanol, biodiesel and biogas. Biofuels can be combusted in vehicle engines as transport fuels and in stationary engines for heatand electricity generation. They also can be used for domestic heating and cooking (for example, as ethanol gels). Conventional biofuels are principally ethanol produced by fermentation of sugar or starch crops (such as wheat and corn), andFAME biodiesel produced from oil crops such as palm oil and canola and from waste oils and fats. Advanced biofuels are made from feedstocks derived from the lignocellulosic fractions of biomass sources or from algae. They are made usingbiochemical and thermochemical conversion processes, some of which are still under development.
- Biogas/Biomethane.
- Biogas is a gaseous mixture consisting mainly of methane and carbon dioxide produced by the anaerobic digestion of organic matter (broken down by microorganisms in the absenceof oxygen). Organic material and/or waste is converted into biogas in a digester. Suitable feedstocks include agricultural residues, animal wastes, food industry wastes, sewage sludge, purpose-grown green crops and the organic components ofmunicipal solid wastes. Raw biogas can be combusted to produce heat and/or power. It also can be refined to produce biomethane.
- Biomass.
- Any material of biological origin, excluding fossil fuels or peat, that contains a chemical store of energy (originally received from the sun) and that is available for conversion to awide range of convenient energy carriers.
- Biomass, traditional (use of).
- Solid biomass (including fuel wood, charcoal, agricultural and forest residues, and animal dung), that is used in rural areas of developing countries withtraditional technologies such as open fires and ovens for cooking and residential heating. Often the traditional use of biomass leads to high pollution levels, forest degradation and deforestation.
- Biomass energy, modern.
- Energy derived from combustion of solid, liquid and gaseous biomass fuels in high-efficiency conversion systems, which range from small domestic appliances to large-scaleindustrial conversion plants. Modern applications include heat and electricity generation, combined heat and power (CHP) and transport.
- Biomass gasification.
- In a biomass gasification process, biomass is heated with a constrained amount of air or oxygen, leading to the partial combustion of the fuels and production of a mix ofcombustion gases that, depending on the conditions, can include carbon monoxide and dioxide, methane, hydrogen and more complex materials such as tars. The resulting gas can either be used for power generation (e.g., in an engine or turbine)or else further purified and treated to form a “synthesis gas”. This can then be used to produce fuels including methane, alcohols, and higher hydrocarbon fuels, including bio-gasoline or jet fuel. While gasification for power or heatproduction is relatively common, there are few examples of operating plants producing gas of high enough quality for subsequent synthesis to more complex fuels.
- Biomass pellets.
- Solid biomass fuel produced by compressing pulverised dry biomass, such as waste wood and agricultural residues. Pellets typically are cylindrical in shape with a diameter ofaround 10 millimetres and a length of 30-50 millimetres. Pellets are easy to handle, store and transport and are used as fuel for heating and cooking applications, as well as for electricity generation and CHP. (Also see Torrefiedwood.)
- Biomethane.
- Biogas can be turned into biomethane by removing impurities including carbon dioxide, siloxanes and hydrogen sulphides, followed by compression. Biomethane can be injected directlyinto natural gas networks and used as a substitute for natural gas in internal combustion engines without risk of corrosion. Biomethane is often known as renewable natural gas (RNG), especially in North America.
- Blockchain.
- A decentralised ledger in which digital transactions (such as the generation and sale of a unit of solar electricity) are anonymously recorded and verified. Each transaction issecurely collected and linked, via cryptography, into a time-stamped “block”. This block is then stored on distributed computers as a “chain”. Blockchain may be used in energy markets, including for micro-trading among solar PVprosumers.
- Building energy codes and standards.
- Rules specifying the minimum energy standards for buildings. These can include standards for renewable energy and energy efficiency that are applicable to newand/or renovated and refurbished buildings.
- Capacity.
- The rated power of a heat or electricity generating plant, which refers to the potential instantaneous heat or electricity output, or the aggregate potential output of a collection ofsuch units (such as a wind farm or set of solar panels). Installed capacity describes equipment that has been constructed, although it may or may not be operational (e.g., delivering electricity to the grid, providinguseful heat or producing biofuels).
- Capacity factor.
- The ratio of the actual output of a unit of electricity or heat generation over a period of time (typically one year) to the theoretical output that would be produced if the unitwere operating without interruption at its rated capacity during the same period of time.
- Capital subsidy.
- A subsidy that covers a share of the upfront capital cost of an asset (such as a solar water heater). These include, for example, consumer grants, rebates or one-time payments bya utility, government agency or government-owned bank.
- Carbon intensity.
- Measure of carbon emitted by weight per megajoule of energy produced, or rate of produced greenhouse gas emissions to gross domestic product (GDP).
- Carbon neutrality.
- The achievement of a state in which every tonne of carbon dioxide emitted to the atmosphere is compensated by an equivalent tonne removed (e.g., sequestered). Emissions can becompensated for by carbon offsets.
- City.
- No international criteria or standards exist to determine what a city is. Most definitions of “cities” rely on settlement density and/or population numbers, although the criteria varywidely across countries. Generally, the term “urban area” refers to settlement areas that are more densely populated than suburban or peri-urban communities within the same metropolitan area. The term “city”, meanwhile, has broader meanings:according to the United Nations, it can connote a political or civic entity, a geographic unit, a formalised economy or an infrastructure bundle. In some instances, local communities, neighbourhood associations, urban businesses andindustries may be subsumed under the term “city”. Throughout the report, municipal and city government refers to the local decision-making bodies and government authorities (the mayor’s office,city council, etc.), unless noted otherwise. In addition to municipal governments, key city-level stakeholders include individual citizens, groups of citizens and private enterprises, as well as various civil society groups that are activewithin the city.
- City-wide.
- Extending or happening in all parts of a city.
- Combined heat and power (CHP) (also called co-generation).
- CHP facilities produce both heat and power from the combustion of fossil and/or biomass fuels, as well as from geothermal and solarthermal resources. The term also is applied to plants that recover “waste heat” from thermal power generation processes.
- Community energy.
- An approach to renewable energy development that involves a community initiating, developing, operating, owning, investing and/or benefiting from a project. Communitiesvary in size and shape (e.g., schools, neighbourhoods, partnering city governments, etc.); similarly, projects vary in technology, size, structure, governance, funding and motivation.
- Community choice aggregation (CCA).
- Under a CCA, municipalities themselves (independently or in partnership with an agency running the CCA) aggregate their residents’ and businesses’ electricitydemand and set out to procure electricity for all participating customers city-wide through direct contracts with energy producers or through third-party energy providers. By enabling local communities to procure their own electricity, CCAscan be an attractive option for cities that want more local control over their electricity mix, for instance to increase the share of renewable electricity.
- Competitive bidding.
- See Tendering.
- Concentrating photovoltaics (CPV).
- Technology that uses mirrors or lenses to focus and concentrate sunlight onto a relatively small area of photovoltaic cells that generate electricity (see Solarphotovoltaics).
- Low-, medium- and high-concentration CPV systems (depending on the design of reflectors or lenses used) operate most efficiently in concentrated, direct sunlight.
- Concentrating solar collector technologies.
- Technologies that use mirrors to focus sunlight on a receiver (see Concentrating solar thermal power). These are usually smaller-sized modules that areused for the production of heat and steam below 400 degrees Celsius (°C) for industrial applications, laundries and commercial cooking.
- Concentrating solar thermal power (CSP) (also called solar thermal electricity, STE).
- Technology that uses mirrors to focus sunlight into an intense solar beam that heats a working fluid in asolar receiver, which then drives a turbine or heat engine/ generator to produce electricity. The mirrors can be arranged in a variety of ways, but they all deliver the solar beam to the receiver. There are four types of commercial CSPsystems: parabolic troughs, linear Fresnel, power towers and dish/engines. The first two technologies are line-focus systems, capable of concentrating the sun’s energy to produce temperatures of 400 °C, while the latter two are point-focussystems that can produce temperatures of 800 °C or higher.
- Conversion efficiency.
- The ratio between the useful energy output from an energy conversion device and the energy input into it. For example, the conversion efficiency of a PV module is the ratiobetween the electricity generated and the total solar energy received by the PV module. If 100 kWh of solar radiation is received and 10 kWh of electricity is generated, the conversion efficiency is 10%.
- Crowdfunding.
- The practice of funding a project or venture by raising money – often relatively small individual amounts – from a relatively large number of people (“crowd”), generally using theInternet and social media. The money raised through crowdfunding does not necessarily buy the lender a share in the venture, and there is no guarantee that money will be repaid if the venture is successful. However, some types of crowdfundingreward backers with an equity stake, structured payments and/or other products.
- Curtailment.
- A reduction in the output of a generator, typically on an involuntary basis, from what it could produce otherwise given the resources available. Curtailment of electricity generationhas long been a normal occurrence in the electric power industry and can occur for a variety of reasons, including a lack of transmission access or transmission congestion.
- Degression.
- A mechanism built into policy design establishing automatic rate revisions, which can occur after specific thresholds are crossed (e.g., after a certain amount of capacity iscontracted, or a certain amount of time passes).
- Demand-side management.
- The application of economic incentives and technology in the pursuit of cost-effective energy efficiency measures and load-shifting on the customer side, to achieveleast-cost overall energy system optimisation.
- Demand response.
- Use of market signals such as time-of-use pricing, incentive payments or penalties to influence end-user electricity consumption behaviours. Usually used to balance electricalsupply and demand within a power system.
- Digitalisation.
- The application of digital technologies across the economy, including energy.
- Digitisation.
- The conversion of something (e.g., data or an image) from analogue to digital.
- Distributed generation.
- Generation of electricity from dispersed, generally small-scale systems that are close to the point of consumption.
- Distributed renewable energy.
- Energy systems are considered to be distributed if 1) the systems are connected to the distribution network rather than the transmission network, which implies thatthey are relatively small and dispersed (such as small-scale solar PV on rooftops) rather than relatively large and centralised; or 2) generation and distribution occur independently from a centralised network.
- Distribution grid.
- The portion of the electrical network that takes power off the high-voltage transmission network via sub-stations (at varying stepped-down voltages) and distributes electricityto customers.
- Divestment.
- Removal or selling of an investment from stranded assets, funds, bonds or stocks. Divestment is an opposite action of investment.
- Drop-in biofuel.
- A liquid biofuel that is functionally equivalent to a liquid fossil fuel and is fully compatible with existing fossil fuel infrastructure.
- Electric vehicle (EV).
- Includes any road-, rail-, sea- and air- based transport vehicle that uses electric drive and can take an electric charge from an external source, or from hydrogen in thecase of a fuel cell electric vehicle (FCEV). Electric road vehicles encompass battery electric vehicles (BEVs), plug-in hybrids (PHEVs) and FCEVs, all of which can include passenger vehicles (i.e., electric cars), commercial vehiclesincluding buses and trucks, and two- and three-wheeled vehicles.
- Energy.
- The ability to do work, which comes in a number of forms including thermal, radiant, kinetic, chemical, potential and electrical. Primary energy is the energy embodied in (energypotential of) natural resources, such as coal, natural gas and renewable sources. Final energy is the energy delivered for end-use (such as electricity at an electrical outlet). Conversion losses occur whenever primary energy needs to betransformed for final energy use, such as combustion of fossil fuels for electricity generation.
- Energy audit.
- Analysis of energy flows in a building, process or system, conducted with the goal of reducing energy inputs into the system without negatively affecting outputs.
- Energy conservation.
- Any change in behaviour of an energy- consuming entity for the specific purpose of affecting an energy demand reduction. Energy conservation is distinct from energyefficiency in that it is predicated on the assumption that an otherwise preferred behaviour of greater energy intensity is abandoned. (See Energy efficiency and Energy intensity.)
- Energy efficiency.
- The measure that accounts for delivering more services for the same energy input, or the same amount of services for less energy input. Conceptually, this is the reduction oflosses from the conversion of primary source fuels through final energy use, as well as other active or passive measures to reduce energy demand without diminishing the quality of energy services delivered. Energy efficiency istechnology-specific and distinct from energy conservation, which pertains to behavioural change. Both energy efficiency and energy conservation can contribute to energy demand reduction.
- Energy intensity.
- Primary energy consumption per unit of economic output. Energy intensity is a broader concept than energy efficiency in that it is also determined by non-efficiency variables,such as the composition of economic activity. Energy intensity typically is used as a proxy for energy efficiency in macro-level analyses due to the lack of an internationally agreed- upon high-level indicator for measuring energyefficiency.
- Energy service company (ESCO).
- A company that provides a range of energy solutions including selling the energy services from a (renewable) energy system on a long-term basis while retainingownership of the system, collecting regular payments from customers and providing necessary maintenance service. An ESCO can be an electric utility, co-operative, non-governmental organisation or private company, and typically installs energysystems on or near customer sites. An ESCO also can advise on improving the energy efficiency of systems (such as a building or an industry) as well as on methods for energy conservation and energy management.
- Energy subsidy.
- A government measure that artificially reduces the price that consumers pay for energy or that reduces energy production cost.
- Energy sufficiency.
- Entails a change or shift in actions and behaviours (at the individual and collective levels) in the way energy is used. Results in access to energy for everyone whilelimiting the impacts of energy use on the environment. For example, avoiding the use of cars and spending less time on electrical devices.
- ESG (Environmental, Social and Governance).
- Also known as “sustainable investing”. Corresponds to a collection of standards in measuring sustainability and represents the key factors of a firm’sor an industry’s green investment. Environmental criteria relate to the quality and functioning of the natural environment and natural systems, and also may include pollution, energy use, climate change, greenhouse gas emissions, changes inland use and waste management. Social criteria refer to well-being, human rights, human capital, labour standards in the supply chain, child, slave and bonded labour, workplace health and safety, freedom of association and expression,diversity, relations with local communities, activities in conflict zones, health and access to medicine and consumer protection. Governance criteria relate to the governance of companies and other investee entities, such as disclosure ofinformation, business ethics, bribery and corruption, internal controls and risk management, relationship between a company’s management, shareholders and stakeholders.
- Ethanol (fuel).
- A liquid fuel made from biomass (typically corn, sugar cane or small cereals/grains) that can replace petrol in modest percentages for use in ordinary spark-ignition engines(stationary or in vehicles), or that can be used at higher blend levels (usually up to 85% ethanol, or 100% in Brazil) in slightly modified engines, such as those provided in “flex-fuel” vehicles. Ethanol also is used in the chemical andbeverage industries.
- Fatty acid methyl esters (FAME).
- See Biodiesel.
- Feed-in policy (feed-in tariff or feed-in premium).
- A policy that typically guarantees renewable generators specified payments per unit (e.g., USD per kWh) over a fixed period. Feed-in tariff(FIT) policies also may establish regulations by which generators can interconnect and sell power to the grid. Numerous options exist for defining the level of incentive, such as whether the payment is structured as a guaranteed minimum price(e.g., a FIT), or whether the payment floats on top of the wholesale electricity price (e.g., a feed-in premium).
- Final energy.
- The part of primary energy, after deduction of losses from conversion, transmission and distribution, that reaches the consumer and is available to provide heating, hot water,lighting and other services. Final energy forms include, among others, electricity, district heating, mechanical energy, liquid hydrocarbons such as kerosene or fuel oil, and various gaseous fuels such as natural gas, biogas andhydrogen.
- (Total) Final energy consumption (TFEC).
- Energy that is supplied to the consumer for all final energy services such as transport, cooling and lighting, building or industrial heating ormechanical work. Differs from total final consumption (TFC), which includes all energy use in end-use sectors (TFEC) as well as for non-energy applications, mainly various industrial uses, such as feedstocks for petrochemical manufacturing.
- Fiscal incentive.
- An incentive that provides individuals, households or companies with a reduction in their contribution to the public treasury via income or other taxes.
- Flywheel energy storage.
- Energy storage that works by applying available energy to accelerate a high-mass rotor (flywheel) to a very high speed and thereby storing energy in the system asrotational energy.
- Front-of-meter system.
- Any power generation or storage device on the distribution or transmission side of the network. (Also see Behind-the-meter system.)
- Generation.
- The process of converting energy into electricity and/or useful heat from a primary energy source such as wind, solar radiation, natural gas, biomass, etc.
- Geothermal energy.
- Heat energy emitted from within the earth’s crust, usually in the form of hot water and steam. It can be used to generate electricity in a thermal power plant or to provideheat directly at various temperatures.
- Green bond.
- A bond issued by a bank or company, the proceeds of which will go entirely into renewable energy and other environmentally friendly projects. The issuer will normally label it as agreen bond. There is no internationally recognised standard for what constitutes a green bond.
- Green building.
- A building that (in its construction or operation) reduces or eliminates negative impacts and can create positive impacts on the climate and natural environment. Countries andregions have a variety of characteristics that may change their strategies for green buildings, such as building stock, climate, cultural traditions, or wide-ranging environmental, economic and social priorities – all of which shape theirapproach to green building.
- Green energy purchasing.
- Voluntary purchase of renewable energy – usually electricity, but also heat and transport fuels – by residential, commercial, government or industrial consumers, eitherdirectly from an energy trader or utility company, from a third-party renewable energy generator or indirectly via trading of renewable energy certificates (such as renewable energy credits, green tags and guarantees of origin). It can createadditional demand for renewable capacity and/or generation, often going beyond that resulting from government support policies or obligations.
- Heat pump.
- A device that transfers heat from a heat source to a heat sink using a refrigeration cycle that is driven by external electric or thermal energy. It can use the ground(geothermal/ground-source), the surrounding air (aerothermal/air-source) or a body of water (hydrothermal/water-source) as a heat source in heating mode, and as a heat sink in cooling mode. A heat pump’s final energy output can be severalmultiples of the energy input, depending on its inherent efficiency and operating condition. The output of a heat pump is at least partially renewable on a final energy basis. However, the renewable component can be much lower on a primaryenergy basis, depending on the composition and derivation of the input energy; in the case of electricity, this includes the efficiency of the power generation process. The output of a heat pump can be fully renewable energy if the inputenergy is also fully renewable.
- Hydropower.
- Electricity derived from the potential energy of water captured when moving from higher to lower elevations. Categories of hydropower projects include run-of-river, reservoir-basedcapacity and low-head in-stream technology (the least developed). Hydropower covers a continuum in project scale from large (usually defined as more than 10 MW of installed capacity, but the definition varies by country) to small, mini, microand pico.
- Hydrotreated vegetable oil (HVO) and hydrotreated esters and fatty acids (HEFA).
- Biofuels produced by using hydrogen to remove oxygen from waste cooking oils, fats and vegetable oils. The resultis a hydrocarbon that can be refined to produce fuels with specifications that are closer to those of diesel and jet fuel than is biodiesel produced from triglycerides such as fatty acid methyl esters (FAME).
- Inverter (and micro-inverter), solar.
- Inverters convert the direct current (DC) generated by solar PV modules into alternating current (AC), which can be fed into the electric grid or used by alocal, off-grid network. Conventional string and central solar inverters are connected to multiple modules to create an array that effectively is a single large panel. By contrast, micro-inverters convert generation from individual solar PVmodules; the output of several micro-inverters is combined and often fed into the electric grid. A primary advantage of micro-inverters is that they isolate and tune the output of individual panels, reducing the effects that shading orfailure of any one (or more) module(s) has on the output of an entire array. They eliminate some design issues inherent to larger systems, and allow for new modules to be added as needed.
- Investment.
- Purchase of an item of value with an expectation of favourable future returns. In this report, new investment in renewable energy refers to investment in: technology research anddevelopment, commercialisation, construction of manufacturing facilities and project development (including the construction of wind farms and the purchase and installation of solar PV systems). Total investment refers to new investment plusmerger and acquisition (M&A) activity (the refinancing and sale of companies and projects).
- Investment tax credit.
- A fiscal incentive that allows investments in renewable energy to be fully or partially credited against the tax obligations or income of a project developer, industry,building owner, etc.
- Joule.
- A joule (J) is a unit of work or energy equal to the work done by a force equal to one newton acting over a distance of one metre. One joule is equal to one watt-second (the power of onewatt exerted over the period of one second). The potential chemical energy stored in one barrel of oil and released when combusted is approximately 6 gigajoules (GJ); a tonne of oven- dry wood contains around 20 GJ of energy.
- Levelised cost of energy/electricity (LCOE).
- The cost per unit of energy from an energy generating asset that is based on the present value of its total construction and lifetime operating costs,divided by total energy output expected from that asset over its lifetime.
- Long-term strategic plan.
- A strategy to achieve energy savings over a specified period of time (i.e., several years), including specific goals and actions to improve energy efficiency, typicallyspanning all major sectors.
- Mandate/Obligation.
- A measure that requires designated parties (consumers, suppliers, generators) to meet a minimum – and often gradually increasing – standard for renewable energy (or energyefficiency), such as a percentage of total supply, a stated amount of capacity, or the required use of a specified renewable technology. Costs generally are borne by consumers. Mandates can include renewable portfolio standards (RPS);building codes or obligations that require the installation of renewable heat or power technologies (often in combination with energy efficiency investments); renewable heat purchase requirements; and requirements for blending specifiedshares of biofuels (biodiesel or ethanol) into transport fuel.
- Market concession model.
- A model in which a private company or non-governmental organisation is selected through a competitive process and given the exclusive obligation to provide energyservices to customers in its service territory, upon customer request. The concession approach allows concessionaires to select the most appropriate and cost-effective technology for a given situation.
- Merit order.
- A way of ranking available sources of energy (particularly electricity generation) in ascending order based on short-run marginal costs of production, such that those with the lowestmarginal costs are the first ones brought online to meet demand, and those with the highest are brought on last. The merit-order effect is a shift of market prices along the merit-order or supply curve due to market entry of power stationswith lower variable costs (marginal costs). This displaces power stations with the highest production costs from the market (assuming demand is unchanged) and admits lower-priced electricity into the market.
- Mini-grid / Micro-grid.
- For distributed renewable energy systems for energy access, a mini-grid/micro-grid typically refers to an independent grid network operating on a scale of less than 10 MW(with most at very small scale) that distributes electricity to a limited number of customers. Mini-/micro-grids also can refer to much larger networks (e.g., for corporate or university campuses) that can operate independently of, or inconjunction with, the main power grid. However, there is no universal definition differentiating mini- and micro-grids.
- Micromobility.
- Micromobility includes modes such as electric sidewalk / “kick” scooters and dockless bicycles (both electric and traditional), as well as electric moped-style scooters andride-hailing and car-sharing services. Many new mobility service companies have committed to sustainability measures, including the use of renewable electricity for charging vehicles as well as for operations.
- Molten salt.
- An energy storage medium used predominantly to retain the thermal energy collected by a solar tower or solar trough of a concentrating solar power plant, so that this energy can beused at a later time to generate electricity.
- Monitoring.
- Energy use is monitored to establish a basis for energy management and to provide information on deviations from established patterns.
- Municipal operations.
- Services or infrastructure that are owned and/or operated by municipal governments. This may include municipal buildings and transport fleets (such as buses, policy vehiclesand refuse collection trucks).
- Municipal solid waste.
- Waste materials generated by households and similar waste produced by commercial, industrial or institutional entities. The wastes are a mixture of renewable plant andfossil-based materials, with the proportions varying depending on local circumstances. A default value that assumes that at least 50% of the material is “renewable” is often applied.
- Net metering / Net billing.
- A regulated arrangement in which utility customers with on-site electricity generators can receive credits for excess generation, which can be applied to offsetconsumption in other billing periods. Under net metering, customers typically receive credit at the level of the retail electricity price. Under net billing, customers typically receive credit for excess power at a rate that is lower than theretail electricity price. Different jurisdictions may apply these terms in different ways, however.
- Net-zero.
- Net-zero emission refers to achieving an overall balance between greenhouse gas emissions produced and greenhouse gas emissions emitted from the atmosphere. Equating the amount of gasessuch as carbon dioxide, methane, nitrous oxide, which are released into the atmosphere due to human-induced activities and cause the greenhouse effect, with the amount of greenhouse gases naturally absorbed by the earth.
- Net zero carbon building / Net zero energy building / Nearly zero energy building.
- Various definitions have emerged of buildings that achieve high levels of energy efficiency and meet remainingenergy demand with either on-site or off-site renewable energy. For example, the World Green Building Council’s Net Zero Carbon Buildings Commitment considers use of renewable energy as one of five key components that characterise a net zerobuilding. Definitions of net zero carbon, net zero energy and nearly zero energy buildings can vary in scope and geographic relevance.
- Non-motorised transport (NMT).
- Walking, cycling, and their variants; also called “active transport” or “human-powered travel”.
- Ocean power.
- Refers to technologies used to generate electricity by harnessing from the ocean the energy potential of ocean waves, tidal range (rise and fall), tidal streams, ocean (permanent)currents, temperature gradients (ocean thermal energy conversion) and salinity gradients. The definition of ocean power used in this report does not include offshore wind power or marine biomass energy.
- Off-take agreement.
- An agreement between a producer of energy and a buyer of energy to purchase/sell portions of the producer’s future production. An off-take agreement normally is negotiatedprior to the construction of a renewable energy project or installation of renewable energy equipment in order to secure a market for the future output (e.g., electricity, heat). Examples of this type of agreement include power purchaseagreements and feed-in tariffs.
- Off-taker.
- The purchaser of the energy from a renewable energy project or installation (e.g., a utility company) following an off-take agreement. (See Off-take agreement.)
- Pay-as-you-go (PAYGo).
- A business model that gives customers (mainly in areas without access to the electricity grid) the possibility to purchase small-scale energy-producing products, such assolar home systems, by paying in small instalments over time.
- Peaker generation plant.
- Power plants that run predominantly during peak demand periods for electricity. Such plants exhibit the optimum balance – for peaking duty – of relatively high variablecost (fuel and maintenance cost per unit of generation) relative to fixed cost per unit of energy produced (low capital cost per unit of generating capacity).
- Pico solar devices / pico solar systems.
- Small solar systems such as solar lanterns that are designed to provide only a limited amount of electricity service, usually lighting and in some casesmobile phone charging. Such systems are deployed mainly in areas that have no or poor access to electricity. The systems usually have a power output of 1-10 watts and a voltage of up to 12 volts.
- Plug-in hybrid electric vehicle.
- This differs from a simple hybrid vehicle, as the latter uses electric energy produced only by braking or through the vehicle’s internal combustion engine.Therefore, only a plug-in hybrid electric vehicle allows for the use of electricity from renewable sources. Although not an avenue for increased penetration of renewable electricity, hybrid vehicles contribute to reduced fuel demand andremain far more numerous than EVs.
- Power.
- The rate at which energy is converted into work, expressed in watts (joules/second).
- Power purchase agreement (PPA).
- A contract between two parties, one that generates electricity (the seller) and one that is looking to purchase electricity (the buyer).
- Power-to-gas (P2G).
- The conversion of electricity, either from renewable or conventional sources, to a gaseous fuel (for example, hydrogen or methane).
- Primary energy.
- The theoretically available energy content of a naturally occurring energy source (such as coal, oil, natural gas, uranium ore, geothermal and biomass energy, etc.) before itundergoes conversion to useful final energy delivered to the end-user. Conversion of primary energy into other forms of useful final energy (such as electricity and fuels) entails losses. Some primary energy is consumed at the end-user levelas final energy without any prior conversion.
- Primary energy consumption.
- The direct use of energy at the source, or supplying users with unprocessed fuel.
- Product and sectoral standards.
- Rules specifying the minimum standards for certain products (e.g., appliances) or sectors (industry, transport, etc.) for increasing energy efficiency.
- Production tax credit.
- A tax incentive that provides the investor or owner of a qualifying property or facility with a tax credit based on the amount of renewable energy (electricity, heat orbiofuel) generated by that facility.
- Productive use of energy.
- Often used in the context of distributed renewables for energy access to refer to activities that use energy to generate income, increase productivity, enhance diversityand create economic value. Productive uses of energy may include local activities such as agriculture, livestock and fishing; light mechanical works such as welding, carpentry and water pumping; small retail and commercial activities such astailoring, printing, catering and entertainment; and small and medium-scale production such as agro-processing (grinding, milling and husking), refrigeration and cold storage, drying, preserving and smoking.
- Property Assessed Clean Energy (PACE) financing.
- Provides access to low-interest loans for renewable energy and energy efficiency improvements that can be repaid through increases on propertytaxes. It was originally conceived of in the United States of America and now is beginning to expand worldwide.
- Prosumer.
- An individual, household or small business that not only consumes energy but also produces it. Prosumers may play an active role in energy storage and demand-side management.
- Public financing.
- A type of financial support mechanism whereby governments provide assistance, often in the form of grants or loans, to support the development or deployment of renewable energytechnologies.
- Pumped storage.
- Plants that pump water from a lower reservoir to a higher storage basin using surplus electricity, and that reverse the flow to generate electricity when needed. They are notenergy sources but means of energy storage and can have overall system efficiencies of around 80-90%.
- Regulatory policy.
- A rule to guide or control the conduct of those to whom it applies. In the renewable energy context, examples include mandates or quotas such as renewable portfolio standards,feed-in tariffs and technology/fuel-specific obligations.
- (Re-)Municipalisation.
- Legal process by which municipalities assume control of their electricity procurement and distribution assets, generally through purchase from private entities.
- Renewable energy certificate (REC).
- A certificate awarded to certify the generation of one unit of renewable energy (typically 1 MWh of electricity but also less commonly of heat). In systemsbased on RECs, certificates can be accumulated to meet renewable energy obligations and also provide a tool for trading among consumers and/or producers. They also are a means of enabling purchases of voluntary green energy.
- Renewable hydrogen.
- Hydrogen produced from renewable energy, most commonly through the use of renewable electricity to split water into hydrogen and oxygen in an electrolyser. The vast majorityof hydrogen is still produced from fossil fuels, and the majority of policies and programmes focused on hydrogen do not include a focus on renewables-based production.
- Renewable natural gas (RNG).
- Gas that is produced through the anaerobic digestion of organic matter and processed to remove the carbon dioxide and other gases, leaving methane that meets a highspecification and that can be interchangeable with conventional natural gas. See Biomethane.
- Renewable portfolio standard (RPS).
- An obligation placed by a government on a utility company, group of companies or consumers to provide or use a predetermined minimum targeted renewable shareof installed capacity, or of electricity or heat generated or sold. A penalty may or may not exist for non-compliance. These policies also are known as “renewable electricity standards”, “renewable obligations” and “mandated market shares”,depending on the jurisdiction.
- Reverse auction.
- See Tendering.
- Sector integration (also called sector coupling).
- The integration of energy supply and demand across electricity, thermal and transport applications, which may occur via co-production, combineduse, conversion and substitution.
- Smart energy system.
- An energy system that aims to optimise the overall efficiency and balance of a range of interconnected energy technologies and processes, both electrical and non- electrical(including heat, gas and fuels). This is achieved through dynamic demand- and supply-side management; enhanced monitoring of electrical, thermal and fuel-based system assets; control and optimisation of consumer equipment, appliances andservices; better integration of distributed energy (on both the macro and micro scales); and cost minimisation for both suppliers and consumers.
- Smart grid.
- Electrical grid that uses information and communications technology to co-ordinate the needs and capabilities of the generators, grid operators, end-users and electricity marketstakeholders in a system, with the aim of operating all parts as efficiently as possible, minimising costs and environmental impacts and maximising system reliability, resilience and stability.
- Smart grid technology.
- Advanced information and control technology that is required for improved systems integration and resource optimisation on the grid.
- Smart inverter.
- An inverter with robust software that is capable of rapid, bidirectional communications, which utilities can control remotely to help with issues such as voltage and frequencyfluctuations in order to stabilise the grid during disruptive events.
- Solar collector.
- A device used for converting solar energy to thermal energy (heat), typically used for domestic water heating but also used for space heating, for industrial process heat or todrive thermal cooling machines. Evacuated tube and flat plate collectors that operate with water or a water/glycol mixture as the heat-transfer medium are the most common solar thermal collectors used worldwide. These are referred to asglazed water collectors because irradiation from the sun first hits a glazing (for thermal insulation) before the energy is converted to heat and transported away by the heat transfer medium. Unglazed water collectors, often referred to asswimming pool absorbers, are simple collectors made of plastics and used for lower- temperature applications. Unglazed and glazed air collectors use air rather than water as the heat-transfer medium to heat indoor spaces or to pre-heat dryingair or combustion air for agriculture and industry purposes.
- Solar cooker.
- A cooking device for household and institutional applications that converts sunlight to heat energy that is retained for cooking. There are several types of solar cookers, includingbox cookers, panel cookers, parabolic cookers, evacuated tube cookers and trough cookers.
- Solar home system.
- A stand-alone system composed of a relatively low-power photovoltaic module, a battery and some- times a charge controller that can provide modest amounts of electricity forhome lighting, communications and appliances, usually in rural or remote regions that are not connected to the electricity grid. The term solar home system kit is also used to define systems that usually are branded and have components thatare easy for users to install and use.
- Solar photovoltaics (PV).
- A technology used for converting light directly into electricity. Solar PV cells are constructed from semiconducting materials that use sunlight to separate electronsfrom atoms to create an electric current. Modules are formed by interconnecting individual cells. Building-integrated PV (BIPV) generates electricity and replaces conventional materials in parts of a building envelope, such as the roof orfacade.
- Solar photovoltaic-thermal (PV-T).
- A solar PV-thermal hybrid system that includes solar thermal collectors mounted beneath PV modules to convert solar radiation into electrical and thermalenergy. The solar thermal collector removes waste heat from the PV module, enabling it to operate more efficiently.
- Solar-plus-storage.
- A hybrid technology of solar PV with battery storage. Other types of renewable energy-plus-storage plants also exist.
- Solar water heater (SWH).
- An entire system consisting of a solar collector, storage tank, water pipes and other components. There are two types of solar water heaters: pumped solar water heatersuse mechanical pumps to circulate a heat transfer fluid through the collector loop (active systems), whereas thermosyphon solar water heaters make use of buoyancy forces caused by natural convection (passive systems).
- Storage battery.
- A type of battery that can be given a new charge by passing an electric current through it. A lithium-ion battery uses a liquid lithium-based material for one of its electrodes.A lead-acid battery uses plates made of pure lead or lead oxide for the electrodes and sulphuric acid for the electrolyte, and remains common for off-grid installations. A flow battery uses two chemical components dissolved in liquidscontained within the system and most commonly separated by a membrane. Flow batteries can be recharged almost instantly by replacing the electrolyte liquid, while simultaneously recovering the spent material forre-energisation.
- Sustainable aviation fuel.
- According to the International Civil Aviation Organization, such fuels are produced from three families of bio-feedstock: the family of oils and fats (ortriglycerides), the family of sugars and the family of lignocellulosic feedstock.
- Target.
- An official commitment, plan or goal set by a government (at the local, state, national or regional level) to achieve a certain amount of renewable energy or energy efficiency by a futuredate. Targets may be backed by specific compliance mechanisms or policy support measures. Some targets are legislated, while others are set by regulatory agencies, ministries or public officials.
- Tender (also called auction / reverse auction or tender).
- A procurement mechanism by which renewable energy supply or capacity is competitively solicited from sellers, who offer bids at thelowest price that they would be willing to accept. Bids may be evaluated on both price and non-price factors.
- Thermal energy storage.
- Technology that allows the transfer and storage of thermal energy. (See Molten salt.)
- Torrefied wood.
- Solid fuel, often in the form of pellets, produced by heating wood to 200-300 °C in restricted air conditions. It has useful characteristics for a solid fuel including relativelyhigh energy density, good grindability into pulverised fuel and water repellence.
- Transmission grid.
- The portion of the electrical supply distribution network that carries bulk electricity from power plants to sub-stations, where voltage is stepped down for furtherdistribution. High-voltage transmission lines can carry electricity between regional grids in order to balance supply and demand.
- Variable renewable energy (VRE).
- A renewable energy source that fluctuates within a relatively short time frame, such as wind and solar energy, which vary within daily, hourly and even sub-hourlytime frames. By contrast, resources and technologies that are variable on an annual or seasonal basis due to environmental changes, such as hydropower (due to changes in rainfall) and thermal power plants (due to changes in temperature ofambient air and cooling water), do not fall into this category.
- Vehicle fuel standard.
- A rule specifying the minimum fuel economy of automobiles.
- Vehicle-to-grid (V2G).
- A system in which electric vehicles – whether battery electric or plug-in hybrid – communicate with the grid in order to sell response services by returning electricityfrom the vehicles to the electric grid or by altering the rate of charging.
- Virtual net metering.
- Virtual (or group) net metering allows electricity utility consumers to share the output of a renewable power project. By receiving “energy credits” based on project outputand their ownership share of the project, consumers are able to offset costs on their electricity utility bill.
- Virtual power plant (VPP).
- A network of decentralised, independently owned and operated power generating units combined with flexible demand units and possibly also with storage facilities. Acentral control station monitors operation, forecasts demand and supply, and dispatches the networked units as if they were a single power plant. The aim is to smoothly integrate a high number of renewable energy units into existing energysystems; VPPs also enable the trading or selling of power into wholesale markets.
- Virtual power purchase agreement (PPA).
- A contract under which the developer sells its electricity in the spot market. The developer and the corporate off-taker then settle the difference betweenthe variable market price and the strike price, and the off-taker receives the electricity certificates that are generated. This is in contrast to more traditional PPAs, under which the developer sells electricity to the off-takerdirectly.
- Voltage and frequency control.
- The process of maintaining grid voltage and frequency stable within a narrow band through management of system resources.
- Watt.
- A unit of power that measures the rate of energy conversion or transfer. A kilowatt is equal to 1 thousand watts; a megawatt to 1 million watts; and so on. A megawatt-electrical (MWe) isused to refer to electric power, whereas a megawatt-thermal ( MWth) refers to thermal/heat energy produced. Power is the rate at which energy is consumed or generated. A kilowatt-hour is theamount of energy equivalent to steady power of 1 kW operating for one hour.
Energy Units and Conversion Factors
ENERGY UNITS AND CONVERSION FACTORS
| METRIC PREFIXES |
|---|
|
kilo (k) = 10 3 |
|
mega (M) = 10 6 |
|
giga (G) = 10 9 |
|
tera (T) = 10 12 |
|
peta (P) = 10 15 |
|
exa (E) = 10 18 |
Example: 1 TJ = 1,000 GJ = 1,000,000 MJ = 1,000,000,000 kJ = 1,000,000,000,000 J
| VOLUME |
|---|
|
1 m 3 = 1,000 litres (l) 1 US gallon = 3.785412 l 1 Imperial gallon = 4.546090 l |
| ENERGY UNIT CONVERSION | ||||
|---|---|---|---|---|
|
Multiply by: |
GJ |
Toe |
MBtu |
MWh |
|
GJ |
1 |
0.024 |
0.948 |
0.278 |
|
Toe |
41.868 |
1 |
39.683 |
11.630 |
|
MBtu |
1.055 |
0.025 |
1 |
0.293 |
|
MWh |
3.600 |
0.086 |
3.412 |
1 |
Example: 1 MWh x 3.600 = 3.6 GJ
| BIOFUELS CONVERSION |
|---|
| Ethanol: 21.4 MJ / l |
| Biodiesel: 32.7 MJ / l |
| HVO: 34.4 MJ/l |
| Petrol: 36 MJ/l |
| Diesel: 41 MJ/l |
Note on Biofuels: 1) These values can vary with fuel and temperature. 2) Around 1.7 litres of ethanol is energy equivalent to 1 litre of petrol, and around 1.2 litres of biodiesel is energy equivalent to 1 litre of diesel. 3) Energy values from http://ec.europa.eu/eurostat/statistics-explained/index.php/Glossary:Tonnes_of_oil_equivalent_(toe) except HVO, which is from Neste Renewable Diesel Handbook, p. 15, https://www.neste.com/sites/default/files/attachments/neste_renewable_diesel_handbook.pdf.
| SOLAR THERMAL HEAT SYSTEMS |
|---|
| 1 million m2 = 0.7 GWth |
| Used where solar thermal heat data have been converted from square metres (m2) into gigawatts-thermal (GWth), by accepted convention. |
Disclaimer
REN21 releases issue papers and reports to emphasise the importance of renewable energy and to generate discussion on issues central to the promotion of renewable energy. While REN21 papers and reports have benefited from the considerations and input from the REN21 community, they do not necessarily represent a consensus among network participants on any given point. Although the information given in this report is the best available to the authors at the time, REN21 and its participants cannot be held liable for its accuracy and correctness.
The designations employed and the presentation of material in the maps in this report do not imply the expression of any opinion whatsoever concerning the legal status of any region, country, territory, city or area or of its authorities, and is without prejudice to the status of or sovereignty over any territory, to the delimitation of international frontiers or boundaries and to the name of any territory, city or area.
The methodology and taxonomy of the REN21 Policy Database were updated for the Renewables 2025 Global Status Report to improve clarity and reflect evolving policy trends. As a result, data presented in this edition may not be fully comparable with figures published in previous Renewables Global Status Reports.