Downloads
PDFs
- GSR_2025_Factsheet_Demand_Agriculture (PDF, 13.5 MB)
- GSR_2025_Factsheet_Demand_Buildings (PDF, 16.6 MB)
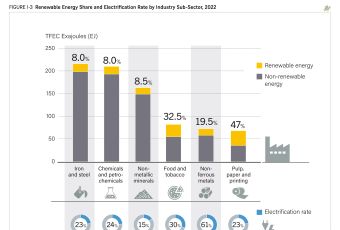
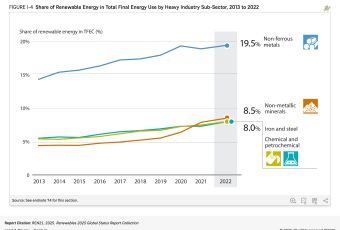
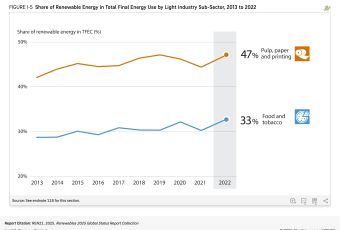
- GSR_2025_Factsheet_Demand_Industry (PDF, 13.6 MB)
- GSR_2025_Factsheet_Demand_Transport (PDF, 12.5 MB)
- GSR_2025_Global_Overview (PDF, 13.0 MB)
- GSR_2025_Factsheet_Supply_Bioenergy (PDF, 9.6 MB)
- GSR_2025_Factsheet_Supply_CSP (PDF, 5.3 MB)
- GSR_2025_Factsheet_Supply_Geothermal (PDF, 6.6 MB)
- GSR_2025_Factsheet_Supply_Hydropower (PDF, 5.1 MB)
- GSR_2025_Factsheet_Supply_STH (PDF, 4.6 MB)
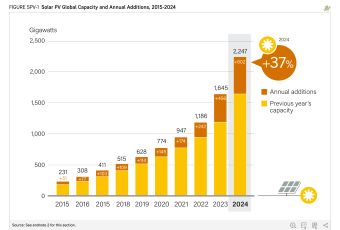
- GSR_2025_Factsheet_Supply_SolarPV (PDF, 9.4 MB)
- GSR_2025_Factsheet_Supply_Wind (PDF, 8.3 MB)